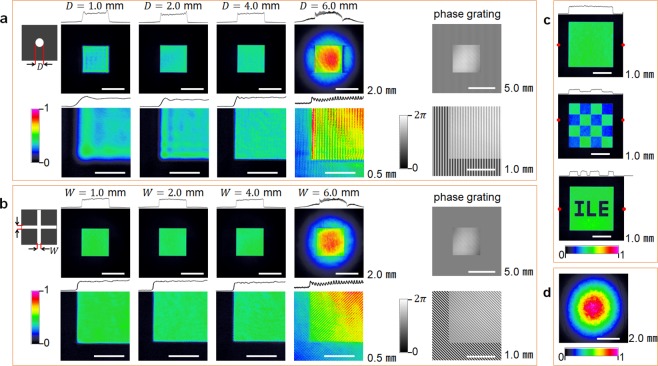
Figure 5.
Flattop and square beam profiles as a function of the shape and size of the SFFs, and corresponding magnified views of the lower left corners. (a) Vertical phase grating. (b) Diagonal phase grating. The upper insets show the horizontal cross-sectional graphs across the centre of the beams, and right insets show the corresponding images of phase gratings. The gray scales show the phase. (c) Addition of checker and ‘ILE’ pattern with diagonal phase grating, and cross-sectional graphs across red points. (d) Original beam profile. The colour bars show signal intensity.

