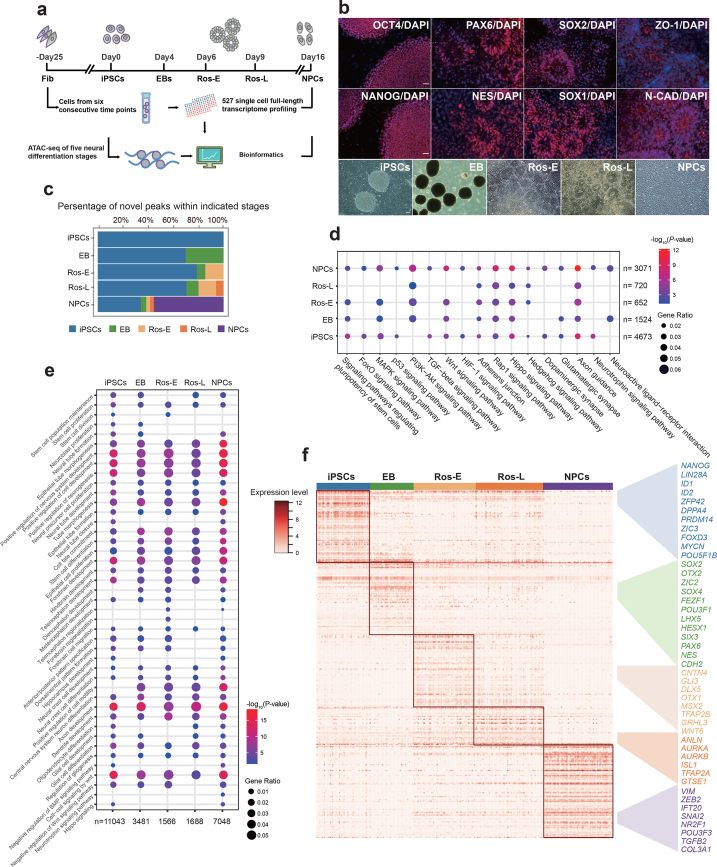
Figure 1:
Transcriptome and regulome dynamics during human early neural differentiation. (a) Schematic illustration of experimental strategy. (b) Bright field and immunostaining of well-defined markers for iPSCs, including OCT4 and NANOG, and for neural rosettes (Ros-L stage), including PAX6, NES (NESTIN), SOX2, SOX1, ZO-1, and N-CAD (N-CADHERIN, also known as CDH2). Scale bar represents 50 μm. (c) Dynamic distribution of novel peaks (active cis-regulatory elements) within indicated cell stages. (d) Kyoto Encyclopedia of Genes and Genomes (KEGG) enrichment analysis of novel peaks within each cell stage as indicated respectively. (e) Gene Ontology (GO) term annotation of novel peaks within each cell stage as indicated respectively. (f) Stage-specific genes highlighted with color specific to the respective neural differentiation cell stage (adjusted P value ≤ 0.01).

