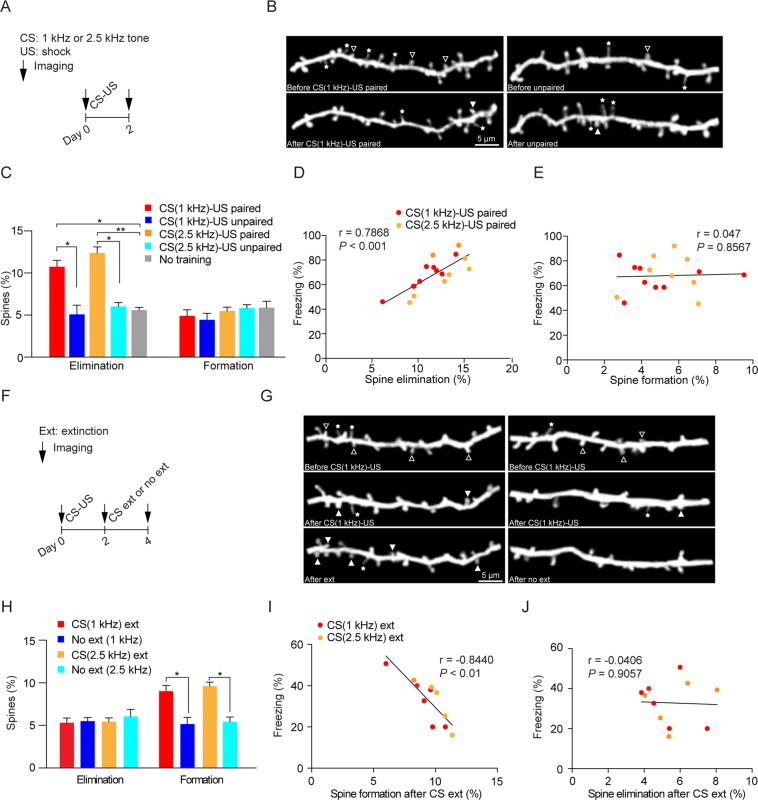
Figure 2.
Fear conditioning and extinction increase spine elimination and formation of apical dendrites of layer 5 pyramidal neurons in the mouse primary motor cortex respectively. (A) Schematic of experimental design. YFP-expressing transgenic mice were subjected to CS (1 or 2.5 kHz tone) paired with US, unpaired stimuli or no training. Imaging was performed before and 2 days after fear conditioning. (B) Representative images of spine formation and spine elimination before and after CS-US pairings or before and after unpaired stimuli. Eliminated spines were identified in the initial view but not in the second view. Newly formed spines were identified in the second view but not in the initial imaging view. The hollow triangles and solid triangles indicate eliminated spines and newly formed spines respectively. The stars indicate filopodia. (C) The rate of dendritic spine elimination, but not formation, was significantly higher in mice subjected to CS-US pairings than that in mice subjected to unpaired stimuli or no training (n = 9 and 3 mice for CS (1 kHz)-US and unpaired groups; n = 9 and 4 mice for CS (2.5 kHz)-US paired and unpaired groups; n = 4 mice for untrained group). The rate of spine elimination or formation after fear conditioning was calculated as the number of eliminated spines or newly formed spines after fear conditioning divided by the number of pre-existing spines in the initial imaging view before fear conditioning. (D-E) Correlation of spine elimination (D) and spine formation (E) with freezing. The rate of spine elimination, but not formation, after fear conditioning was positively correlated with the freezing responses to CS. (F) Schematic of experimental design. Mice were first subjected to CS (1 or 2.5 kHz tone)-US pairings and then subjected to CS extinction or no extinction training. Imaging was performed after CS-US pairings and after CS extinction or no extinction to determine the spine remodeling after CS extinction. (G) Representative images of spine formation and elimination before and after CS-US pairings, and after CS extinction or no extinction. The hollow triangles and solid triangles indicate eliminated spines and newly formed spines respectively. The stars indicate filopodia. (H) The rate of spine formation, but not elimination, was significantly higher in the extinction group as compared to the no extinction group (n = 6 and 5 mice for CS (1 kHz) extinction and no extinction groups; n = 5 and 4 mice for CS (2.5 kHz) extinction and no extinction groups). The rate of spine elimination or formation after fear extinction was calculated as the number of eliminated spines or newly formed spines after fear extinction divided by the number of pre-existing spines in the imaging view before fear extinction. (I,J) The rate of spine formation (I) but not elimination (J) was inversely correlated with the freezing response to CS after extinction. Data are presented as mean ± S.E.M. *P < 0.05; **P < 0.01.

