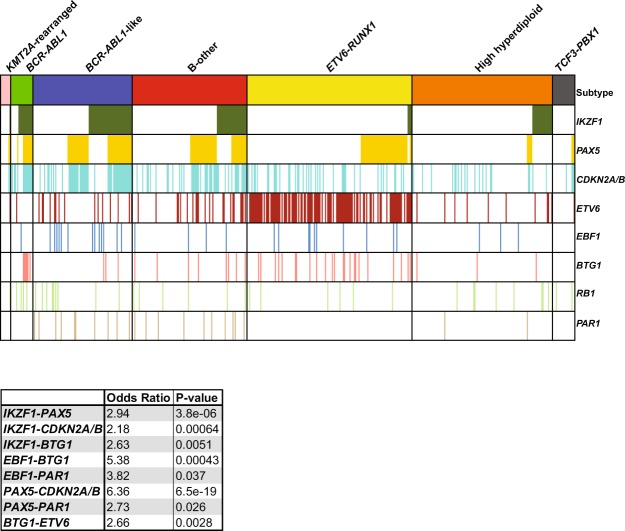
Figure 2.
Co-occurence of CNAs in B-cell development genes in the different BCP-ALL subtypes. Heatmap of CNA profile of 515 newly diagnosed pediatric BCP-ALL patients, representing the major BCP-ALL subtypes. CNAs are shown per subtype. Colors indicate presence of a CNA and absence of CNAs is shown in white. The heatmap is sorted on IKZF1 deletions followed by CNAs in PAX5. Each column represents an individual patient. The co-occurrence between the different CNAs in all BCP-ALL cases was calculated using the Fisher Exact test. Odds ratios and p-values of significant associations are shown.

