
Figure 11.
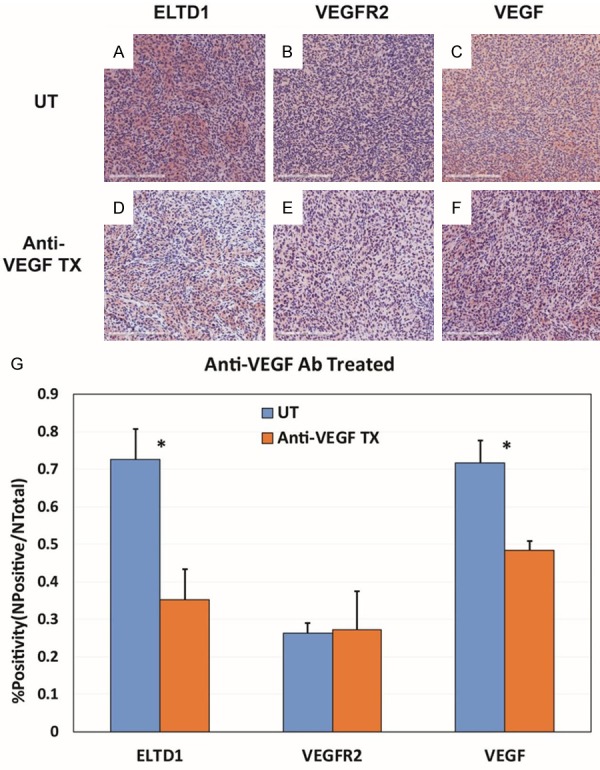
Anti-VEGF Ab treatment significantly reduced the expressions of ELTD1 and VEGF. Representative images of ELTD1 (A), VEGFR2 (B) and VEGF (C) expression levels in untreated G55 tumors, compared to anti-ELTD1 Ab treated tissues (D-F, respectively). (G) Percent positivities for either ELTD1, VEGFR2 or VEGF, show a significant decrease in ELTD1 (P < 0.05) and VEGF (P < 0.05) expressions, but did not show a significant decrease in VEGFR2 expression. Mean ± SD, n = 6.