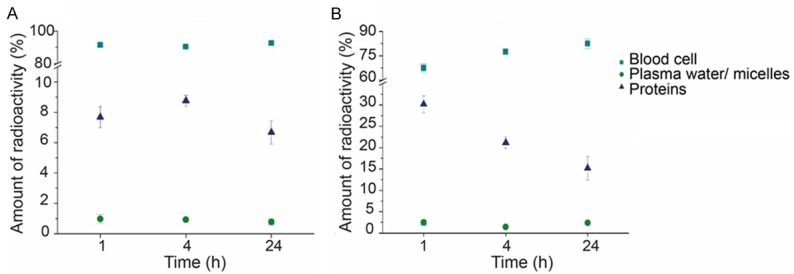
Figure 10.

A. Distribution of 111In[In]-oxine in the blood for up to 24 h (n=3). B. Distribution of 111In[In]-oxine micelles in the blood for up to 24 h (n=3). Data is expressed as percentage of the amount of radioactivity that was present in the whole blood sample (mean ± SEM).
