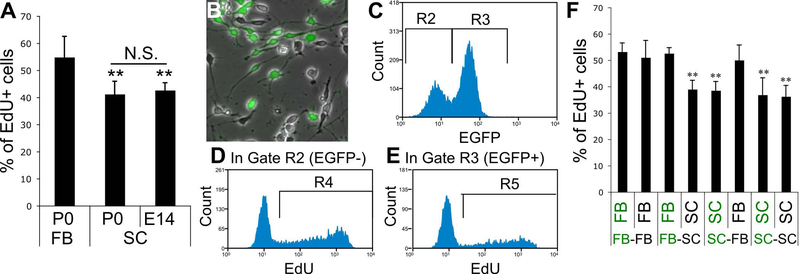
Figure 3.
A, EdU-incorporation assay of OPCs from P0 FB, and P0 and E14 SC. Cells were plated at x1 density. ** indicates p<0.01 (n≥9 wells/group, two-tailed ANOVA followed by Student-Newman-Keuls post hoc test). B-F, OPC proliferation in FB-SC OPC co-cultures. B, Cells were mixed at 1:1 ratio and plated at x1 density. A representative phase contrast image of the co-culture of FB and SC OPCs. The green fluorescent overlay shows EGFP+ FB OPCs isolated from EGFP-transgenic rats. C-E, Representative histograms showing the gating strategy used for the quantification of EdU+ cells in EGFP− and EGFP+ cells in co-cultures. First, EGFP− and EGFP+ cells were gated by the gate R2 and R3, respectively (C). Then, number of EdU+ cells was counted by the gate R4 in the R2 (EGFP−) population (D) and by the gate R5 in the R3 (EGFP+) population (E). F, The percentage of EdU+ cells in EGFP− and EGFP+ cells in co-cultures of all four possible combinations. EGFP− and EGFP+ cells were indicated in black and green letters, respectively. ** indicates p<0.01 (n=12 wells/group, two-tailed ANOVA followed by Student-Newman-Keuls post hoc test).

