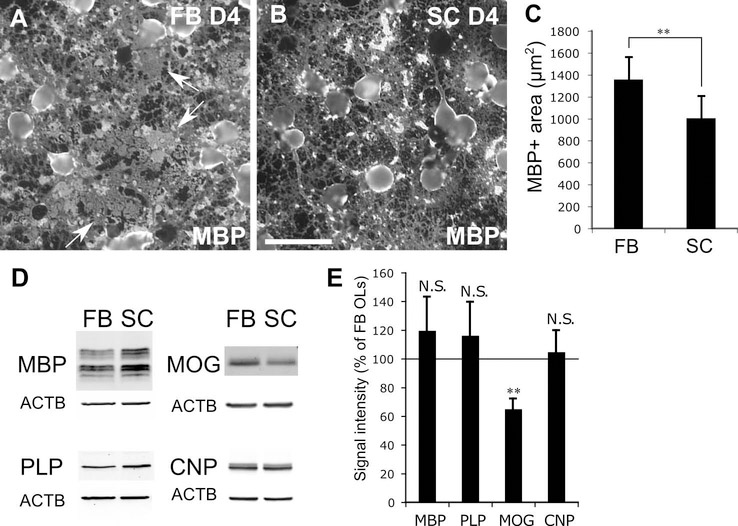
Figure 4.
A-C, In vitro myelin sheet formation by FB and SC OLCs. Representative immunocytochemistry for MBP of FB (A) and SC OLCs (B) at day 4 in differentiation medium. Arrows indicate typical MBP+ myelin sheets observed in FB MOs. Scale bar: 50 μm. C shows the quantification of area covered by MBP immunoreactivity in FB and SC OLC cultures. D-E, Expression of myelin proteins in differentiated FB and SC OLs in vitro. Representative Western blots for MBP, PLP, MOG and CNP (D), and the quantification (E). FB and SC cells were plated at x1 and x4 density, respectively. ** indicates p<0.01 (n=3 independently prepared cultures/group, Student’s t-test).

