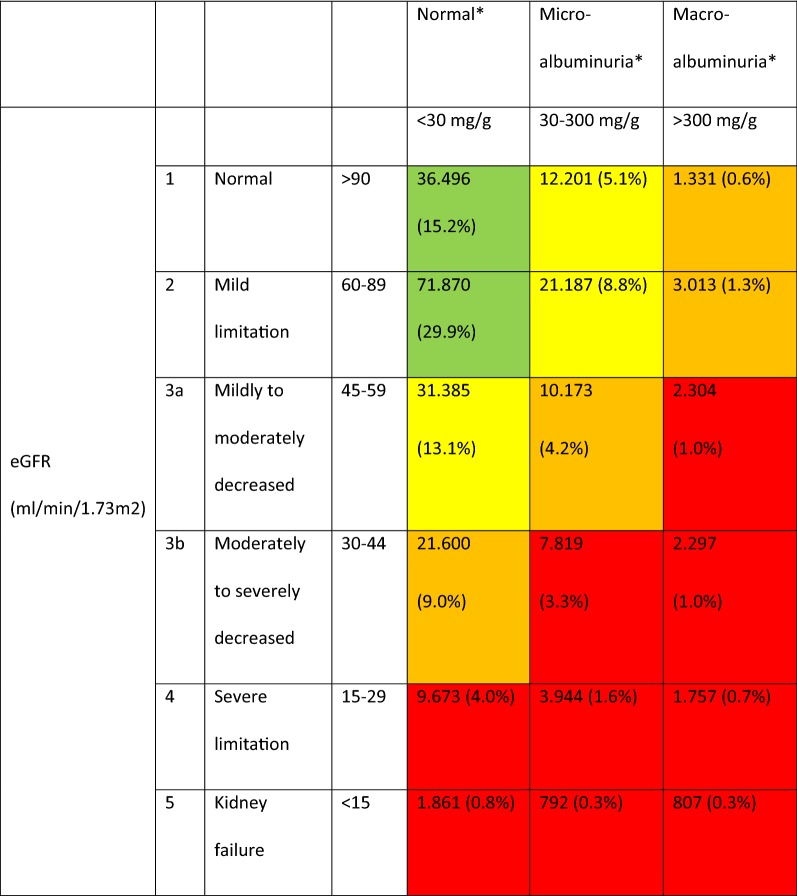
Fig. 2.
Prevalence of chronic kidney disease by GFR and albuminuria (based on [22]). Green, low risk (if no other markers of kidney disease, no CKD); yellow, moderately increased risk; orange, high risk; red, very high risk. *240.510 patients with information on eGFR category and albuminuria, data are presented as absolute numbers (percent of 240.510). n = 103.165 with missing values on microalbuminuria and/or macroalbuminuria

