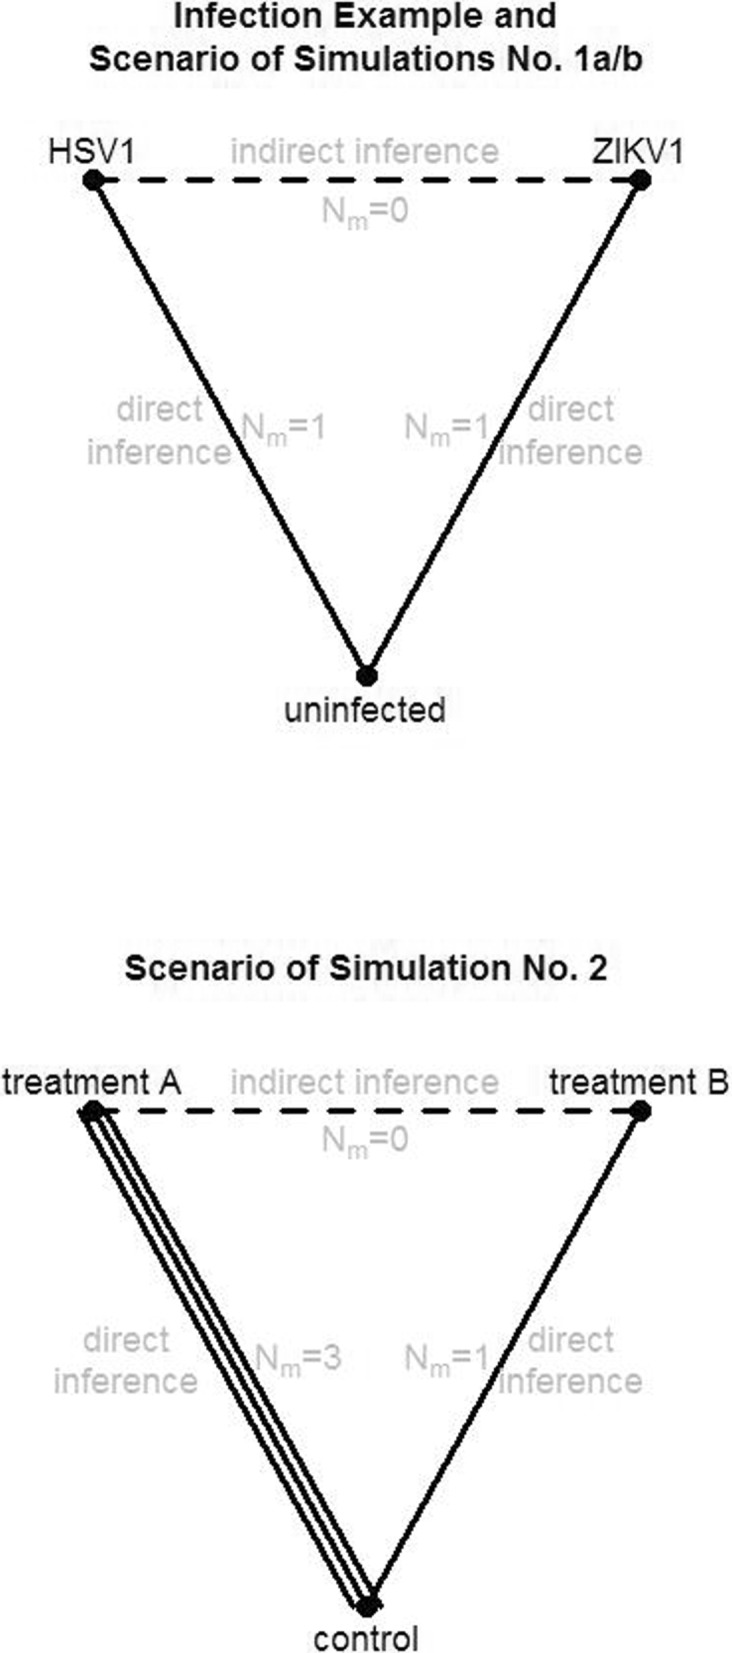
Fig. 1.

Schemes of study networks. Networks were either simulated or represent the infection example. Top: two studies are connected by a similar control group. (This scenario is evaluated in simulations no. 1a and no. 1b and by the infection example.). Bottom: the edge representing the comparison between treatment A and control is supported by three independent studies (This scenario is evaluated in simulation no. 2.)
