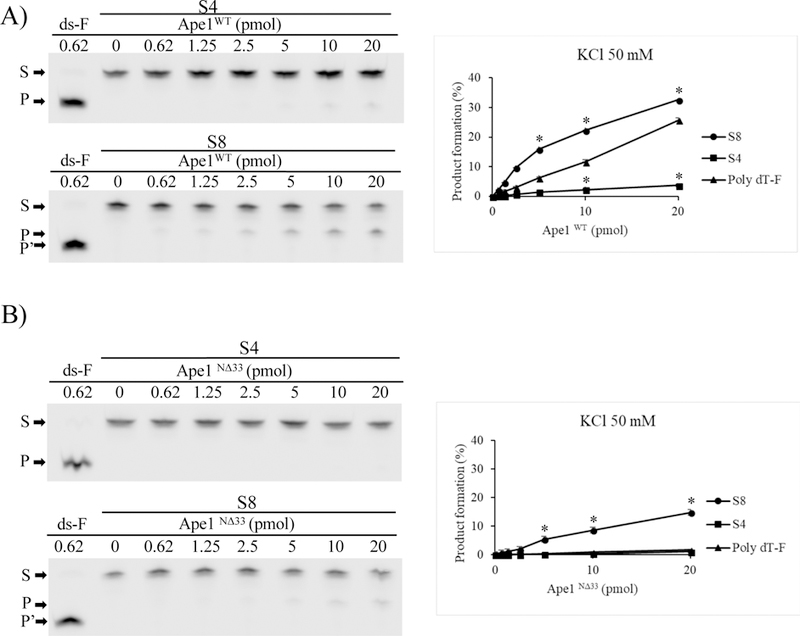
Fig. 3-. The position of the abasic site on the G4 influences Ape1 endonuclease activity.

A) Representative denaturing polyacrylamide gels of AP site incision by Ape1WT on S4 and S8 incubated with the indicated amount of protein in a solution containing 50 mM KCl as described in Materials and methods section (left).
B) Representative denaturing polyacrylamide gels of AP site incision by Ape1N∆33 on S4 and S8 incubated with the indicated amount of protein in a solution containing 50 mM KCl as described in Materials and methods section (left).
Graphs describe the percentage of conversion of substrate (S) into product (P) as a function of the dose of Ape1 protein on the specified substrate (right). ds-F ODN was used as positive control. S denotes the substrate position; the length of the generated products is 1 nt different between S8 (P) and ds-F (P’). Average values are plotted with standard deviations of three loadings of the same experiment as a function of protein dosage. Standard deviation values were always less than 10% of the mean of experimental points. See also supplementary Fig. S5A and S5B for the gels.
