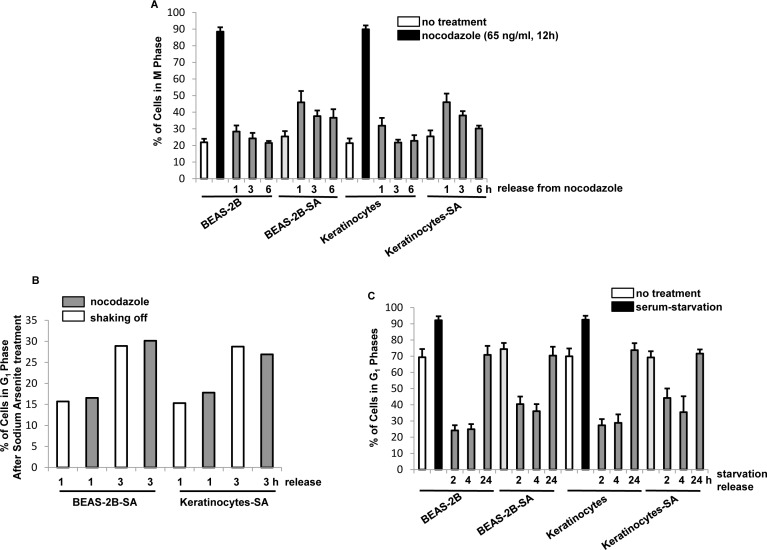
Figure 2. Mitotic accumulation in response to chronic, low dose sodium arsenite treatment.
A. After released from nocodazole block at different time points, the percentages of the cells in mitotic phase were measured by flow cytometry analysis. Error bars are the SD over 5 experiments (n = 5; p < 0.01). B. Mitotic cells were collected through mechanical shaking-off or by nocodazole block at different time points. After being re-propagated in the cultures for 1 or 3 h, the percentages of the cells in G1 phases were measured. Error bars are the SD over 5 experiments (n = 5; p < 0.05). C. Cells were cultured in the medium depriving the serum for 48 h and the percentages of G1 were measured by flow cytometry. Error bars are the SD over 5 experiments (n = 5; p < 0.01).

