
Figure 2.
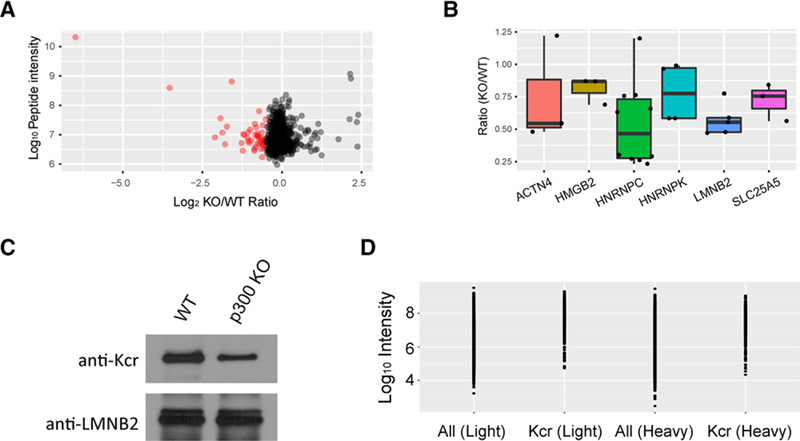
A) Scatter plot shows the quantification of Kcr sites in relation to peptide intensities. The Kcr sites that could only be detected in WT cells are not shown in this scatter plot. B) Box plot shows representative proteins with p300-regulated Kcr sites. C) Validation of the Kcr level change in response to p300 KO by Western blot. D) Graph indicates the abundance distribution of Kcr modified proteins and all proteins in either “light” or “heavy” labeled cells.