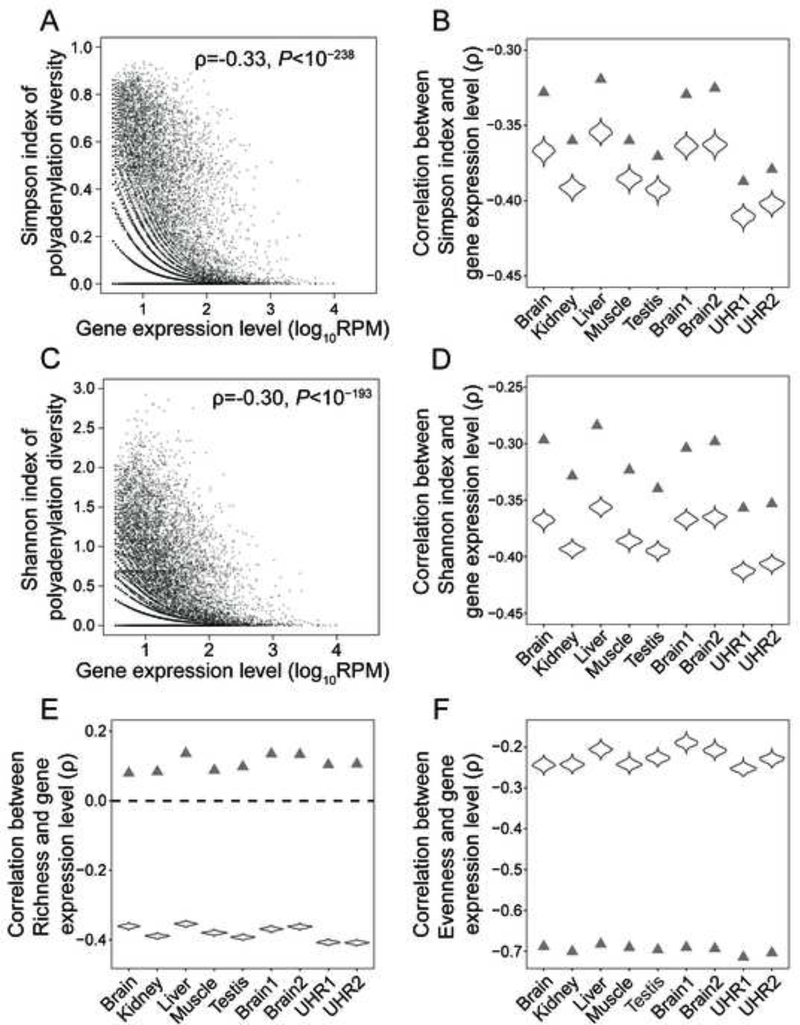
Figure 1. Polyadenylation diversity declines as gene expression increases in humans.
(A) Relationship between the expression level of a gene in human brain and its Simpson index of polyadenylation diversity. In (A) and (C), each dot represents one gene. Spearman’s rank correlation coefficient (ρ) and associated P-values are presented. RPM, number of PolyA-seq reads mapped to a given gene per million reads mapped to all genes in the sample.
(B) Spearman’s correlation between gene expression level and Simpson index in each of nine human tissue samples. In (B), (D), (E), and (F), triangles show the ρ on the basis of the original data, whereas the violin plots show the frequency distributions of ρ on the basis of 1000 down-sampled data in which 10 PolyA-seq reads are randomly sampled per gene. P < 10−37 for all correlations in all panels.
(C) Relationship between the expression level of a gene in human brain and its Shannon index of polyadenylation diversity.
(D) Spearman’s correlation between gene expression level and Shannon index in each of nine human tissue samples.
(E) Spearman’s correlation between gene expression level and polyadenylation site Richness in each of nine human tissue samples.
(F) Spearman’s correlation between gene expression level and polyadenylation site use Evenness in each of nine human tissue samples.
See Methods for the definitions of Simpson index, Shannon index, Richness, and Evenness, and main text for descriptions of tissue samples. See also Figures S1-S3.

