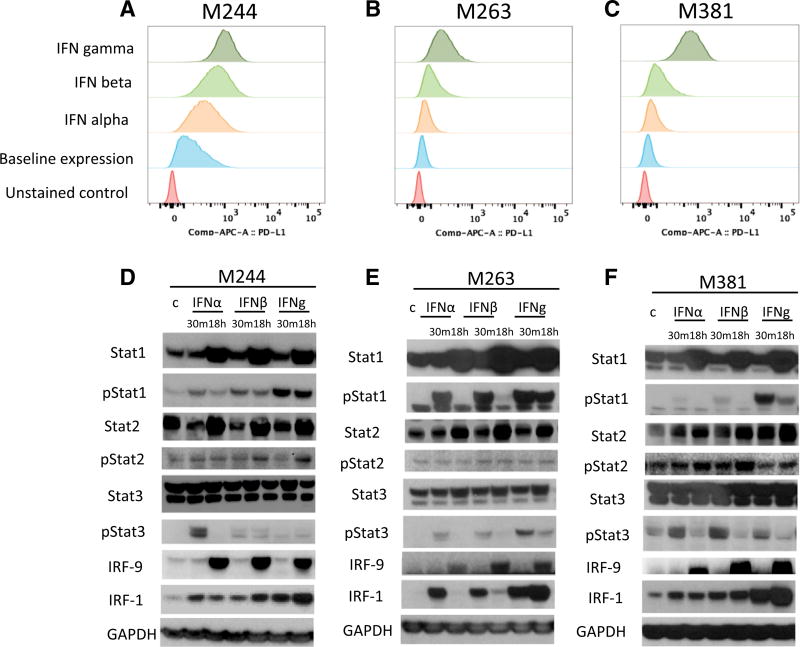
Figure 1. Induction of PD-L1 by Interferon Alpha, Beta, and Gamma.
(A–C) Flow cytometry analysis of PD-L1 surface expression upon interferon treatment in the human melanoma cell lines M244 (A), M263 (B), and M381 (C) exposed to interferon alpha, beta, or gamma for 18 hr. Histograms represent changes in mean fluorescence intensity by flow cytometry compared to baseline. (D–F) Western blot analysis of interferon receptor signaling proteins in M244 (D), M263 (E), and M381 (F), including a set of proteins involved in interferon signaling pathways. Basal and activated (phosphorylated) states of the proteins are included to compare the induction trough these different mediators. The first lane of each panel represents untreated control cells. Each cell line was exposed 30 min or 18 hr with interferon alpha, beta, or gamma, respectively.

