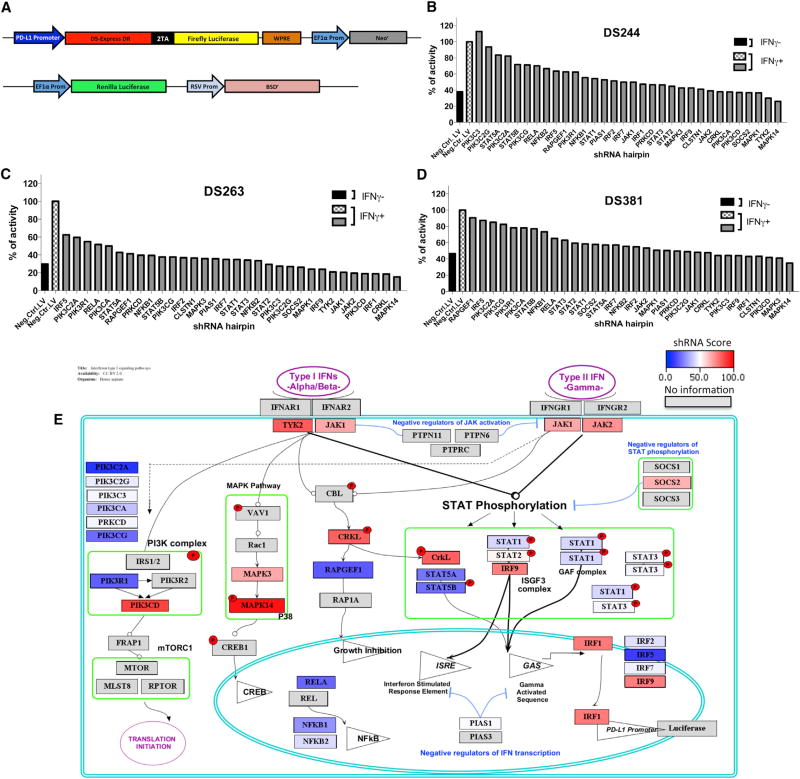
Figure 2. Effects on PD-L1 Reporter Expression upon shRNA Silencing of 33 Genes Involved in the Interferon Signaling Pathway.
(A) Schematic representation of the PD-L1Prom-DSRed-FireflyLuciferase/Neo and EF1AProm-Renilla luciferase/RSV-BSD constructs used to generate the reporter melanoma cell lines. Reporter cells contain the PD-L1 promoter driving the expression of a DSRedDR-T2A-Firefly luciferase cassette and also an EF1-alpha promoter driving the Renilla luciferase gene used for normalization.
(B–D) Normalized luciferase reporter expression of each cell line, M244 (B), M263 (C), and M381 (D), transduced with different sets of lentiviral shRNA hairpins. Black and checkered white bars represent the cells transduced with a lentiviral control containing no shRNA, with (black) or without (checkered) interferon gamma treatment. Gray bars represent the expression level of the cells transduced with a set of lentiviral shRNA hairpins with interferon gamma treatment to compare changes upon the interferon gamma induction of PD-L1 expression. Results are represented as a percentage of luciferase expression compared with the interferon-gamma-treated negative control.
(E) Schematic representation of the interferon receptor signaling pathway depicting the hits taking into account the redundant siRNA/shRNA activity (RSA) score obtained for each factor in the three reporter cell lines. Color heatmap represents the summed rank score, with red indicating the greatest impact on interferon-gamma-induced PD-L1 reporter activity and dark blue the least impact. Spatial orientation places each gene in the context of its signaling pathway.

