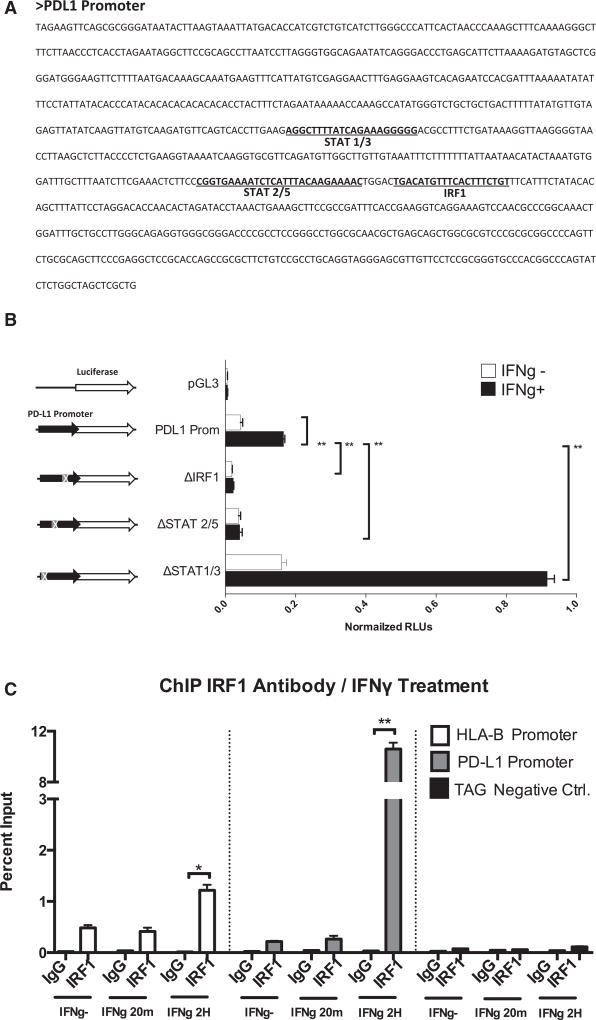
Figure 3. Transient Luciferase Reporter Assays and ChIP Analysis for the PD-L1 Promoter in M381 Melanoma Cells.
(A) Sequence of the PD-L1 promoter showing the position of the most representative putative binding sites of the promoter, STAT1/STAT3, STAT2/STAT5, and IRF1.
(B) PD-L1 promoter transient reporter assay including deletions of the putative binding sites. Results are represented as normalized relative luciferase units (RLUs).
(C) ChIP assay in M381 cells at the PD-L1 promoter (gray), the HLA-B promoter as a positive control (white), and the human tRNA-Leu anti-codon (TAG) as irrelevant sequence for IRF1 binding (negative control). Results are represented as percent enrichment relative to input. Asterisks denote significance in an unpaired t test (*p < 0.005, **p < 0.001), and error bars denote SD.

