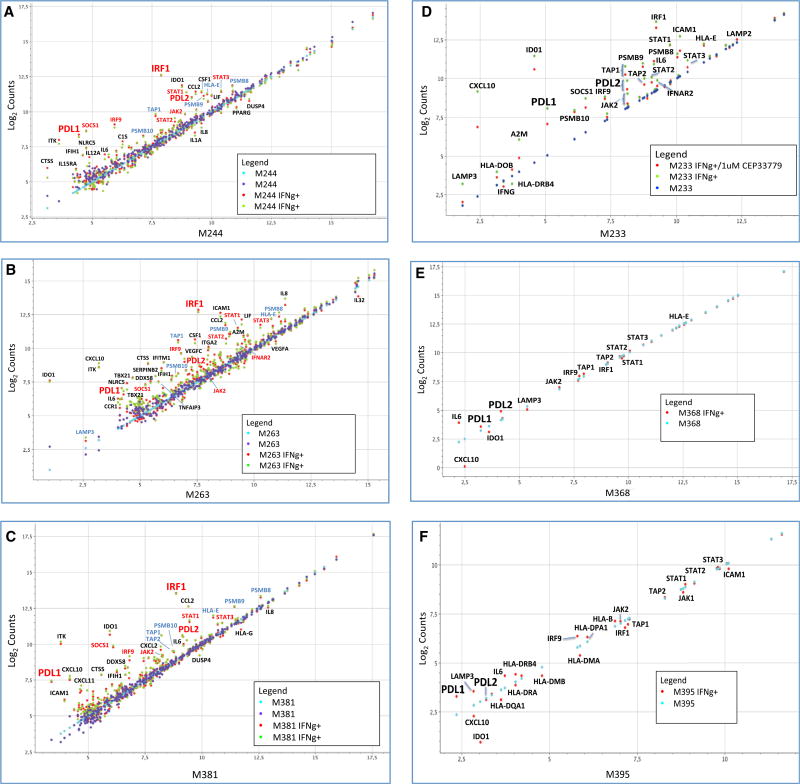
Figure 4. Selected mRNA Expression Profiling of Interferon-Gamma-Induced Genes.
(A–C) Changes in selected gene expression upon interferon gamma exposure in three melanoma cell lines: M244 (A), M263 (B), and M381 (C). Purple and blue dots represent the expression level of the transcripts at basal level in two different biological duplicates (untreated cells), and red and green dots represent the expression level of the transcripts after 3 hr of interferon gamma treatment.
(D) Expression profile analysis of the good interferon gamma responder M233 cell line using the JAK2-specific inhibitor CEP33779. Dark blue dots represent untreated cells, green dots represent interferon-gamma-treated cells, and red dots represent cells treated with the JAK2 inhibitor CEP-33779 and interferon gamma. Data are presented as normalized counts (log2) of each transcript.
(E) Same analysis of the JAK2 mutant cell line M368 with (red) or without (light blue) interferon gamma treatment.
(F) Expression profile of the JAK1 mutant cell line M395 with (red) or without (light blue) interferon gamma treatment.

