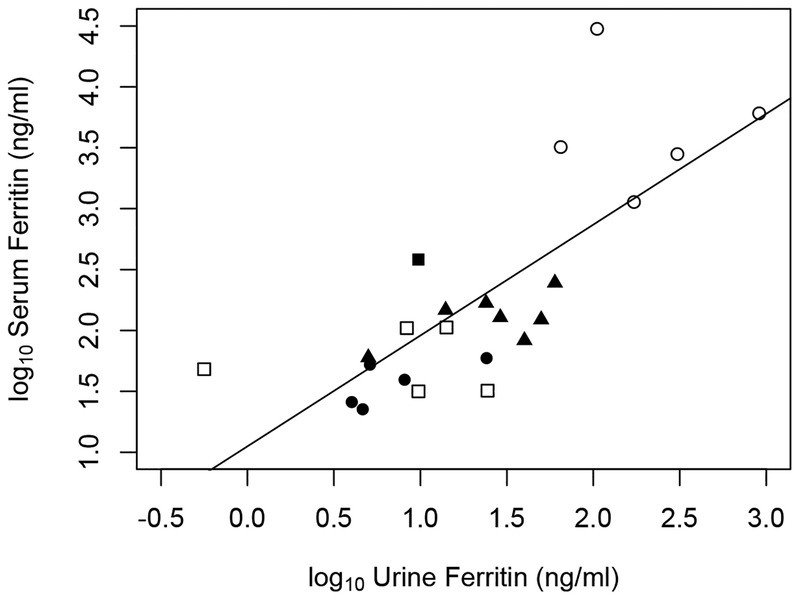
Figure 1.
log10-transformed ferritin concentrations in paired serum/urine collections from five groups, each represented by a different symbol: healthy adult males (closed circle; n=5), term neonates (open square; n=5), stable, growing, preterm neonates in a NICU (closed triangle; n=8), neonates with very high serum ferritin levels (open circle; n=5) and one child with iron-overload and beta-thalassemia (closed square). The straight line is an “identify” line showing the relationship between serum and urine ferritin. The Spearman correlation coefficient of the log10 values is 0.78.

