
Figure 3: PD-1+ T cells have decreased TCR diversity compared to PD-1− cells.
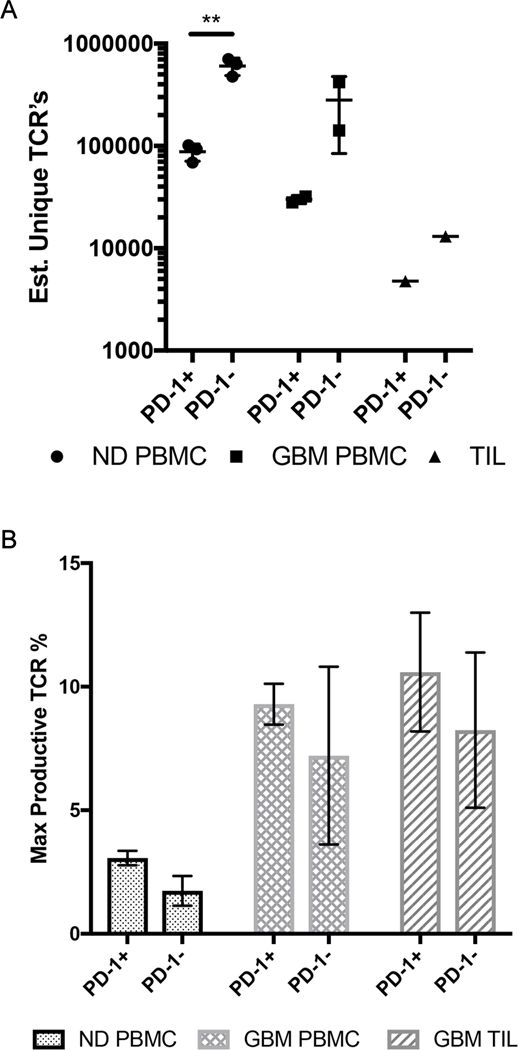
A) The number of estimated unique TCR sequences in PD-1− and PD-1+ populations in healthy donor PBMC, glioma patient PBMC, and glioma patient TILs. Each point represents a single patient. Circle points represent healthy donor PBMCs. Square points represent glioma patient PBMCs. Triangle points represent glioma patient TILs. (**P≤0.005).
B) The frequency of a specific TCR rearrangement in the populations. The populations shown are the CD3+ PD-1− or CD3+ PD-1+ populations from healthy donor PBMCs (dotted bar), glioma patient PBMCs (the checkerboard bar), and glioma patient TILs (slanted stripes bar)