
Figure 4: CD3+ PD-1+ T cells from pooled glioma patient PBMCs produce higher levels of IFN-γ compared to the CD3+ PD-1− T cell population after T cell activation.
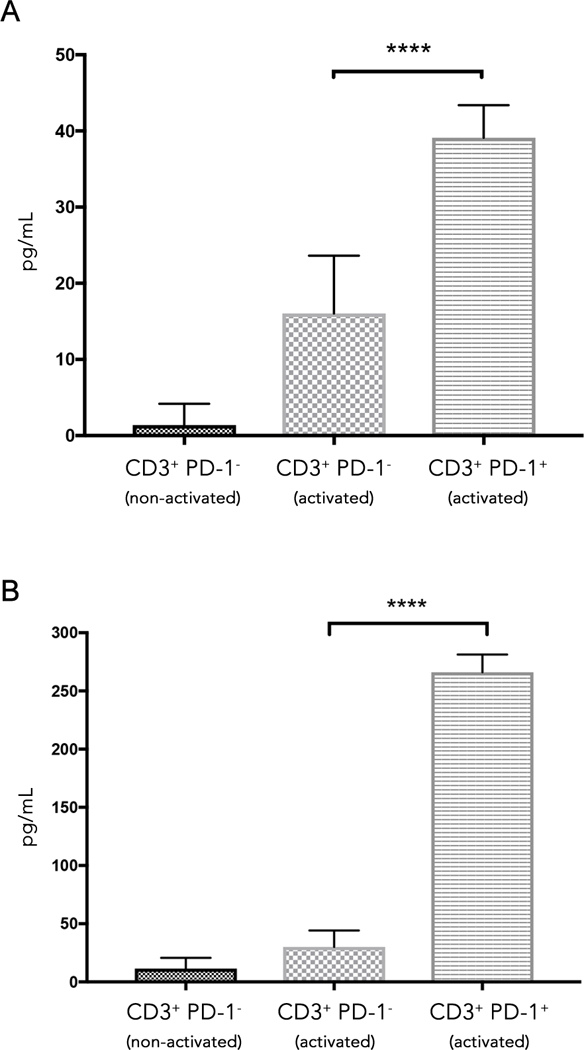
A) The amount of IFN-γ produced in CD3+ PD-1−, and CD3+ PD-1+ T cells from four glioma patient PBMCs 24 hours after CD3/CD28 activation. The dotted bar represents CD3+ PD-1− T cells that were not activated. The checkerboard bar represents CD3+ PD-1− T cells that were activated. The horizontal stripes bar represents CD3+ PD-1+ T cells that were activated. The results presented are a representative experiment that has been repeated multiple times with similar findings.
B) IFN-γ produced at 48hrs from the same set of cells as (A).