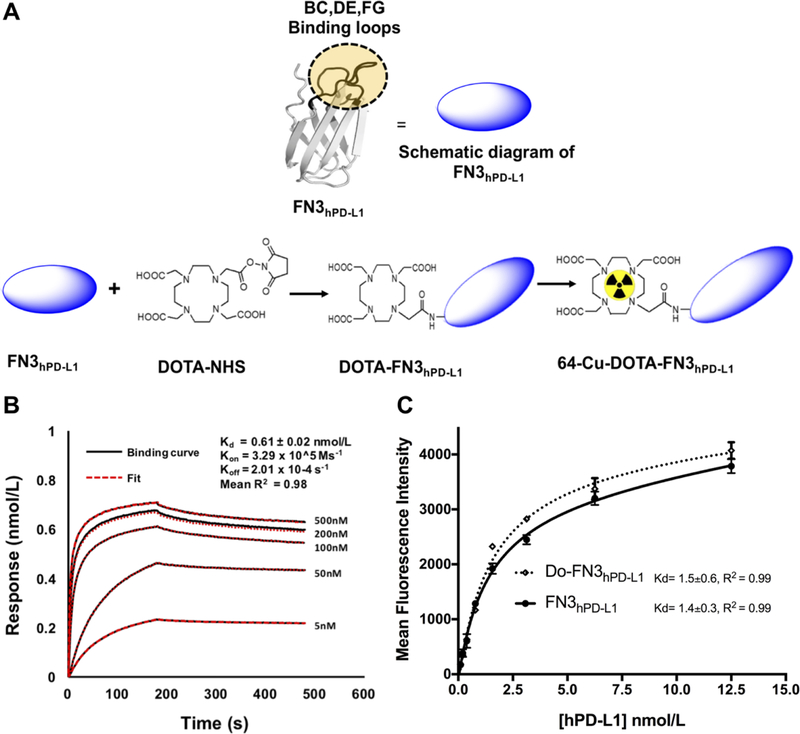
Figure 1: Determination of binding affinity of FN3hPD-L1 to hPD-L1.
A: Pictorial diagram of FN3hPD-L1 and DOTA-FN3hPD-L1. B: Biotinylated FN3hPD-L1 bound hPD-L1 protein with nmol/L affinity. Analyses were performed between the biotinylated FN3hPD-L1 binder (50 nmol/L) coated on the streptavidin-coated sensor, and various concentrations of hPD-L1. The surface changes due to binding of hPD-L1 onto the FN3hPD-L1 binder was measured as response units (nmol/L). A 1:1 binding curve was generated, yielding a Kd value of 0.6±0.02 nmol/L. Data are shown in black, with the corresponding curve fits in red. The R2 value of 0.98 represents the average value of those from the five curves. C: Comparison of binding activities of FN3hPD-L1 and Do-FN3hPD-L1 in intact cells expressing hPD-L1. hPD-L1-expressing CT26 cells were incubated with the indicated concentrations (0.5–12.5 nmol/L) of anti-6x-Histag-APC-FN3hPD-L1 or anti-6x-istag-APC-Do-FN3hPD-L1. The data are expressed as the mean±SD of 3 independent experiments.

