Figure 5.
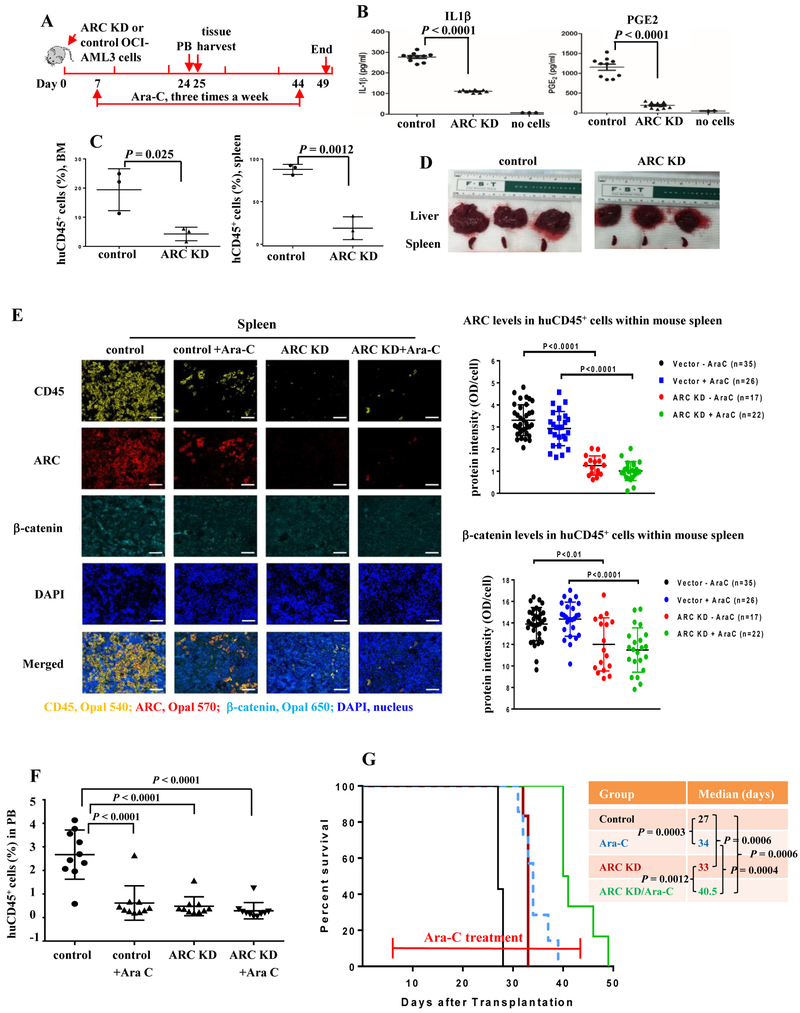
Inhibition of ARC in AML cells reduces serum IL1β and PGE2 levels, decreases leukemia burden in various tissues, prolongs survivals, and sensitizes to Ara-C in NSGS mice. A. In vivo experiment scheme. B. IL1β and PGE2 levels in serum of mice harboring control or ARC KD OCI-AML3 cells determined by ELISA. C. huCD45 positivity in BM and spleen of mice harboring control or ARC KD OCI-AML3 cells determined by flow cytometry. D. Liver and spleen from mice harboring control or ARC KD OCI-AML3 cells. E. Expression of ARC and β-catenin in spleen huCD45+ cells of mice harboring control or ARC KD OCI-AML3 cells with or without Ara-C treatment, determined by Opal/TSA multiplex IHC staining and Vectra multispectral imaging analysis. Left, huCD45 (yellow), ARC (red), β-catenin (cyan), DAPI (blue), and merged imaging (objective lens ×20, scale bar 50 µm). Fluorophores for CD45, ARC, and β-catenin are Opal 540, Opal 570 and Opal 650, respectively. Right, the quantitation of ARC and β-catenin expression in huCD45+ cells of mouse spleen: 35 fields in control cell-injected mice (7,164 to 10,873 cells/field, total 319,431 cells), 26 fields in control cell-injected mice with Ara-C treatment (2,635 to 4,777 cells/field, total 99,727 cells), 17 fields in ARC KD cell-injected mice (610 to 5,021 cells/fields, total 37,206 cells), and 22 fields in ARC KD cell-injected mice with Ara-C treatment (248 to 3,927 cells/field, total 45,431 cells); respectively. F. huCD45 positivity in PB of mice harboring control or ARC KD OCI-AML3 cells with or without Ara-C treatment by flow cytometry. G. Survival of mice injected with control or ARC KD OCI-AML3 cells without or with Ara-C treatment.

