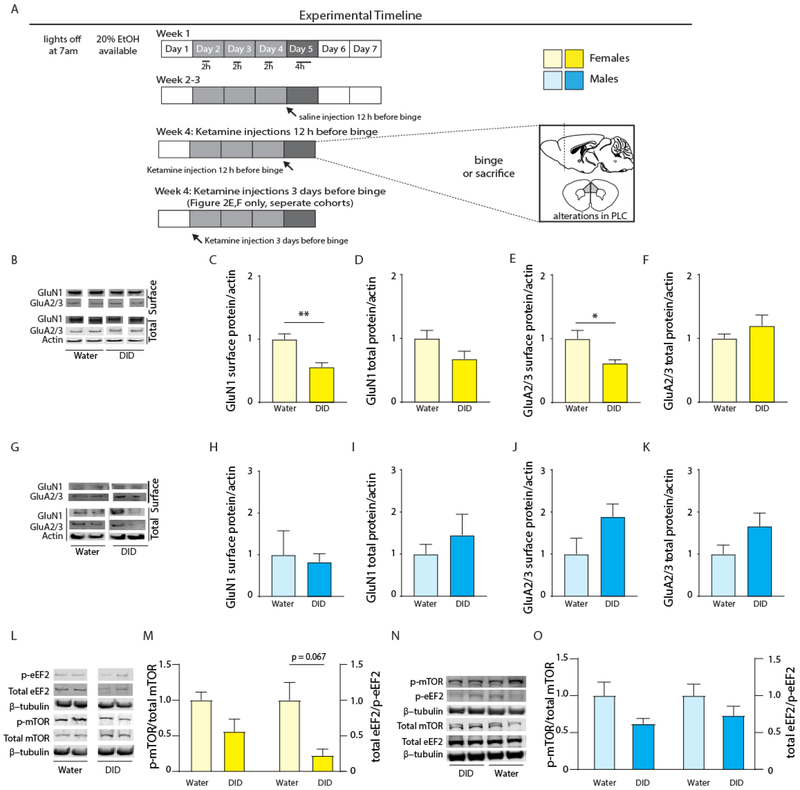
Figure 1: Binge drinking reduces expression of glutamate receptors in the PLC of female, but not male, mice.
(A) Mice were subjected to four cycles of DID or water control conditions followed by analyses of glutamate receptor and mTOR pathway proteins in cell surface or total extracts of the PLC (glutamate receptors) or total extracts of the mPFC (mTOR, eEF2)(Figure 1B-O), behavior (Figure 2), or electrophysiology (Figure 3). In addition to DID exposure, this schematic indicates that the animals analyzed in Figures 2 and 3 (but not the animals used to collect the data in Figure 1B-O) received ketamine or saline either 3 days or 12 h before the ethanol binge. (B-F) DID induced downregulation of cell surface NMDA and AMPARs in female mice. Representative western blots for GluN1, GluA2/3 (surface and total), and actin (total) for water exposed and DID exposed female mice (B). Female mice subjected to four cycles of DID showed significant reductions in cell surface GluN1-containing NMDA receptors (C), with no change in total receptor expression (D). Female mice subjected to four cycles of DID showed significant reductions in cell surface GluA2/3-containing AMPA receptors (E), with no change in total receptor (F). (G-K) Unaltered expression of NMDA and AMPARs of DID exposed male mice. Representative western blots for GluN1, GluA2/3 (surface and total), and actin (total) for water and DID exposed male mice (G). Male mice showed unaltered cell surface (H) and total (I) GluN1-containing NMDARs, or surface (J) and total (K) GluA2/3-containing AMPARs. (L-M) Downregulation of mTOR signaling in mPFC of DID exposed female mice. Representative western blots for p-eEF2, total eEF2, p-mTOR, total mTOR, and β-tubulin (L). Female DID exposed mice showed decreased overall mTOR pathway activity in the mPFC as compared to water controls (M) with near significant reductions in total eEF2 /p-eEF2. (N-O) DID resulted in a similar but insignificant trend in mTOR signaling in the mPFC of male mice. Representative western blots for p-eEF2, total eEF2, p-mTOR, total mTOR, and β-tubulin, male mice (N). Male DID exposed mice showed no significant reductions in mTOR pathway activity in the mPFC as compared to water controls. Data represent means ± SE. *p < 0.05, ** p < 0.01, t-tests.

