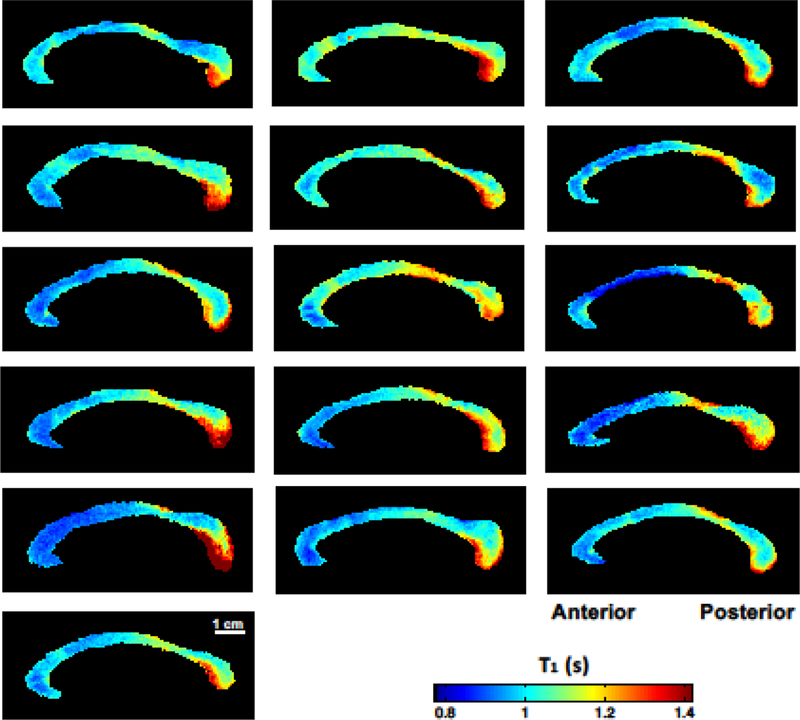
Fig 2.
High-resolution T1 relaxometry maps of the mid-sagittal corpus callosum from 16 healthy human subjects. All T1 maps were displayed in the same scale in the color bar. There was a common pattern of T1 distributions along the CC; the smaller T1 values in the anterior and higher T1 values toward the posterior areas.

