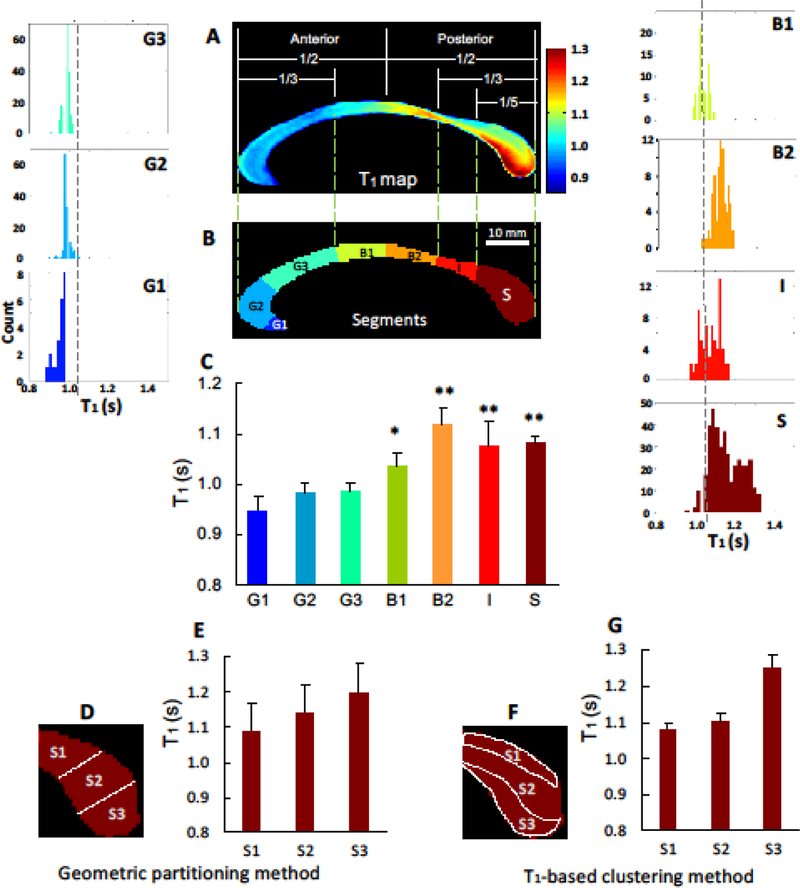
Fig 3.
Histogram analysis of regional T1 distributions of the callosal subdivisions in conjunction with two partitioning methods. According to the geometric partitioning method, the mid-sagittal corpus callosum was segmented into 7 subdivisions: the anterior third including rostrum (G1), genu (G2), rostral-body (G3); midbody including anterior midbody (B1) and posterior midbody (B2); posterior-third including the isthmus (I) and splenium (S). The further segmentation for the splenial subdivisions – superior (S1), middle (S2), and inferior (S3) - were performed using the Witelson’s partitioning (D and E) and T1-based classification method (F and G). Overall, T1 map shows a heterogeneous pattern of T1 distribution from the anterior to the posterior part of the CC. Moreover, T1-based classification method provides the better separation of splenial subdivisions compared to the Witelson’s method. The vertical dashed lines in the histogram panels indicate the mean T1 value (= 1.04 s) of the entire CC structure. All brackets show statistical comparisons for regional callosal T1 compared to mean of the anterior areas (G1~G3) using 2-tailed paired t-test. *P < 0.001, ** P < 0.0001

