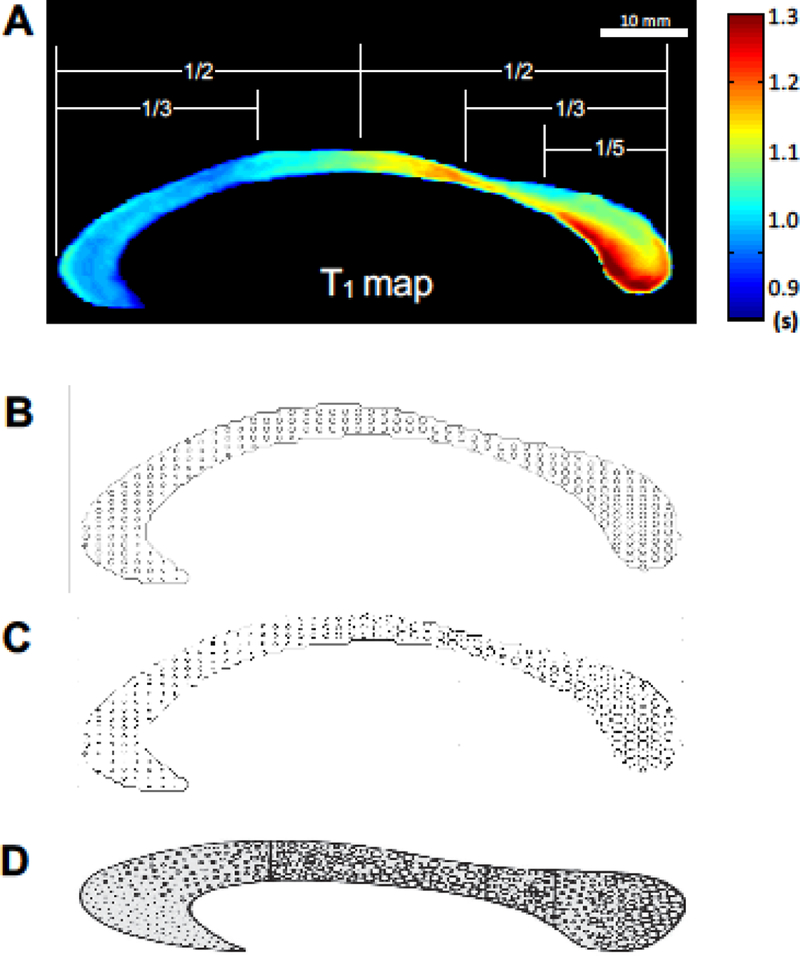
Fig 5.
In vivo axon diameter maps of the human corpus callosum (A–C). Each panel represents the subject-averaged T1 relaxometry map (A), estimated in vivo axon diameter maps (B and C), and manual drawing of axon diameter map reported in the literature (Fig. 1. from the reference (Aboitiz and Montiel 2003)) (D). Panel C was drawn after rescaling the axon size distribution for matching the map shown in (D). There was a qualitatively similar distribution of axon diameter between the in vivo and postmortem estimations: large-size fibers are shown towards the posterior midbody and splenium, while small-size fibers are found in the anterior callosum. Note that all axonal diameter maps provide schematic illustrations by scaling the non-uniform fiber size across the CC, thus, they do not represent the exact ratio of diameters between fibers with varied diameter. The panel in D was reprinted with the permission from the reference (Aboitiz and Montiel 2003).

