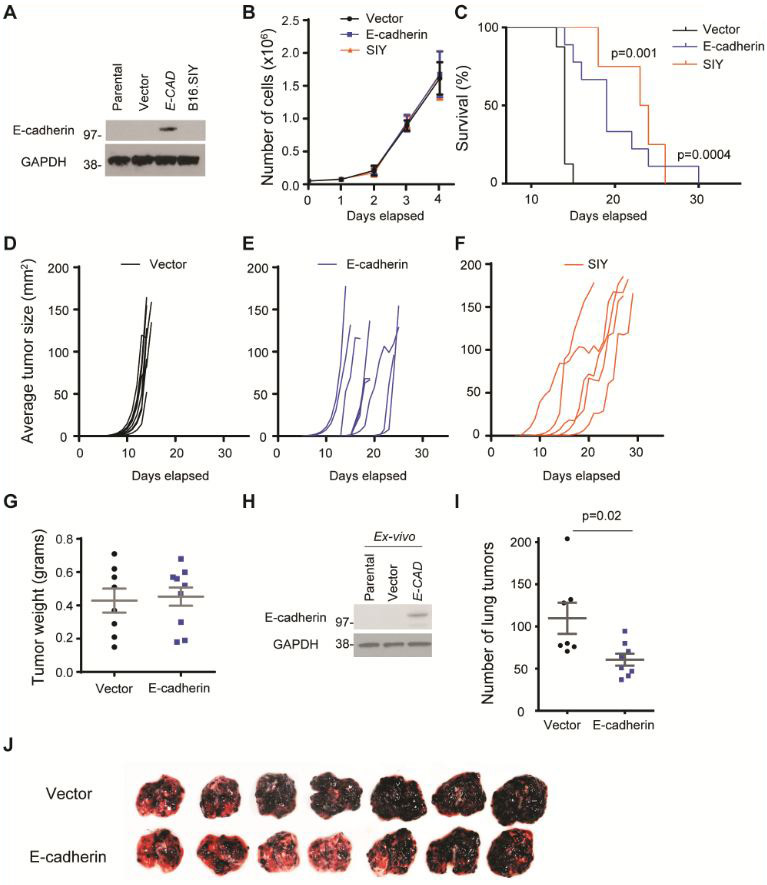
Figure 2. B16.Ecad displays delayed tumor growth and reduced lung metastases.

(A) Western blot analysis of E-cadherin in transduced murine melanoma cells B16.SIY. Parental line= B16F10. Vector= MSCV. GAPDH was used as a loading control. (B) In vitro proliferation of E-cadherin transfected B16F10 cells versus vector control. Cell counting was performed via trypan blue dye exclusion method. Experiment is representative of five independent experiments. (C) Kaplan-Meier plot of overall survival; p values, log-rank test. 1×10⁵ tumor cells were injected into the subcutaneous space on the animal’s flank. (D-F) Tumor growth kinetics in individual mice (n=5-9 per group). (G) Tumor weights upon harvest. (H) Ex-vivo western blot of harvested tumors. (I) Average number of lung metastatic foci as counted by two independent observers. (J) Lung metastases as the result of tail vein injection of either vector or E-cadherin B16 melanoma on day 18 (2×10⁵ tumor cells) (n=7 per group).
