
Figure 4. B16.Ecad shows enhanced responses to combination checkpoint blockade.
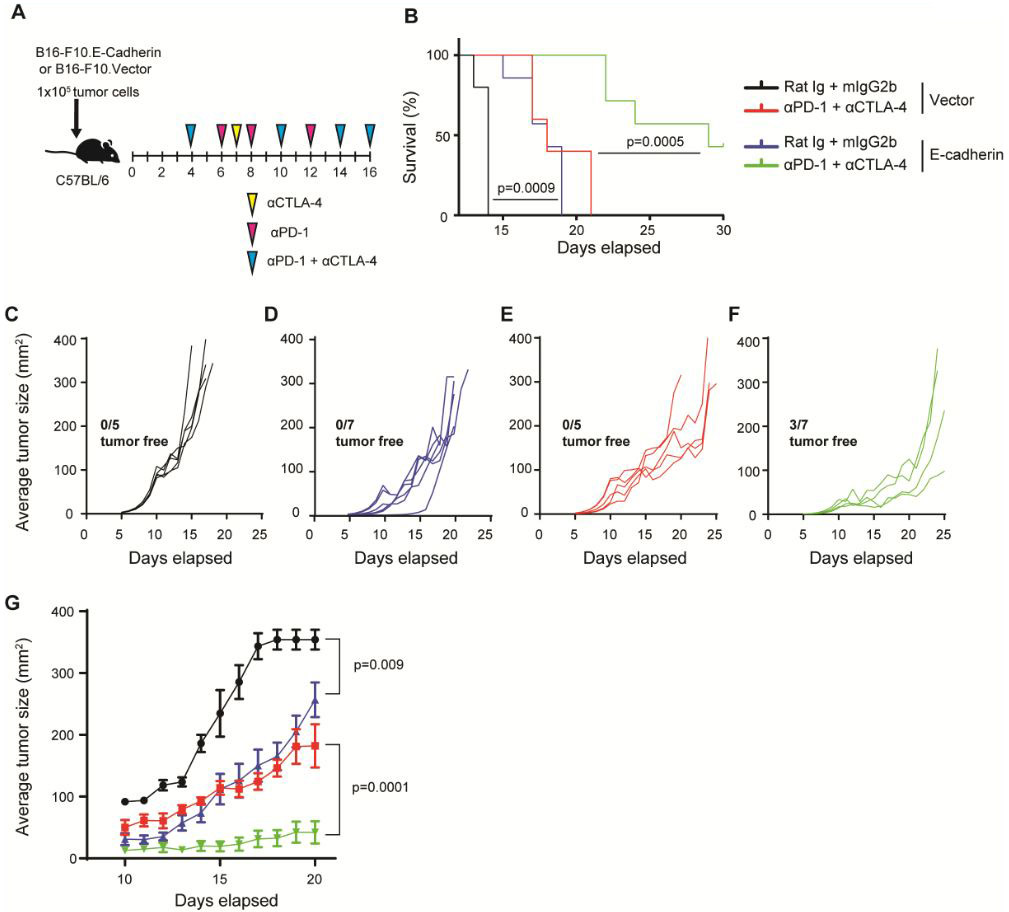
(A) Schema of experimental design showing time points of drug dosing. αCTLA4 or Rat Ig (100 μg) was administered on days 4, 7,10,14,16 i.p., αPD-1 or mIgG2b (250 μg) was administered on days 4,6,8,10,12,14,16 i.p. 1×10⁵ tumor cells were injected into the subcutaneous space on the animal’s flank. (B) Kaplan-Meier plot of overall survival; p values, log-rank test. (C-F) Individual tumor outgrowth measured in mm2 once per day (n=5-7 per group). 3/7 B16.Ecad mice remained tumor free 40 days post injection. All other mice developed tumors. (G) Mean tumor size of each treatment group. Data represent mean ±SEM. Statistical analysis by unpaired Student’s t test.