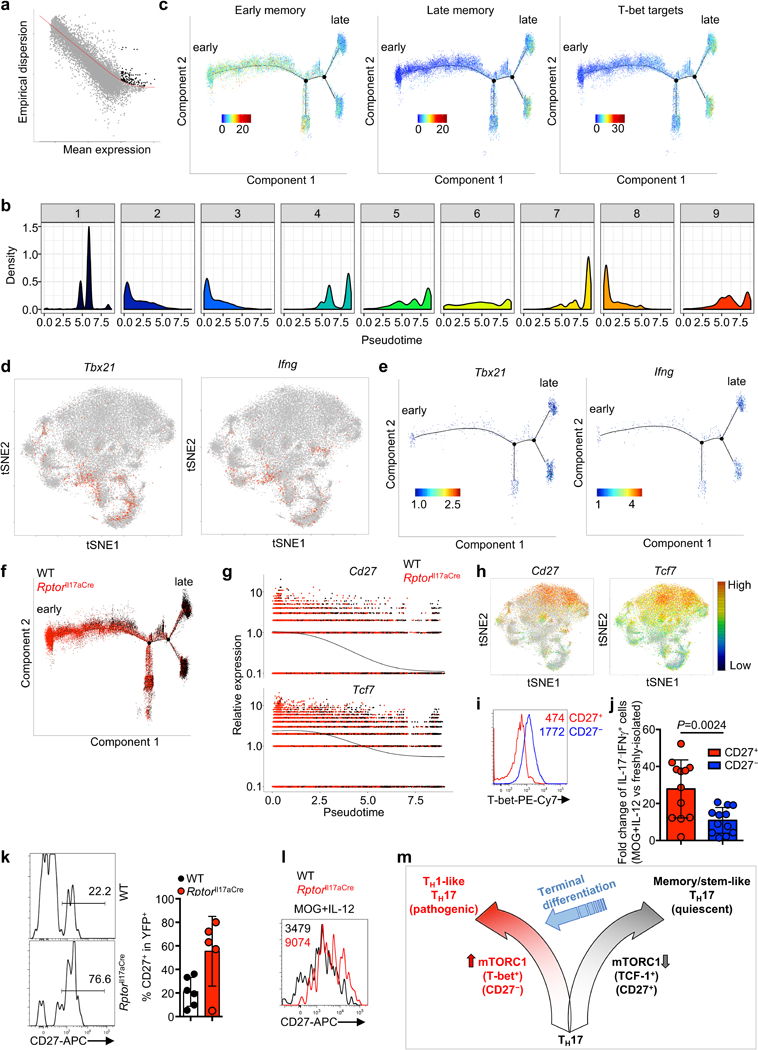
Extended Data Figure 1. CD27 expression on TH17 cells during autoimmunity and cellular homeostasis of CD27+ and CD27− TH17 subsets.

a, Analysis of publically available single cell transcriptomics data of IL-17-GFP+ cells from draining lymph nodes (dLN) compared to central nervous system (CNS) (Gaublomme et al.). b, Flow cytometry analysis of putative memory surface markers on CD4+TCRβ+YFP+ cells from dLN and spleen of mice at day 9 post MOG-immunization. c, Summary of CD27 expression on CD4+TCRβ+YFP+ cells in dLN (red; n = 5, day 5; n = 3, day 7; n = 7, day 9; n = 8, day 16) overlaid with clinical EAE score (black, n = 5). d, Ki-67 expression in CD27+ and CD27− cell populations. e, Flow cytometry analysis (left) and summary (right) of CD27 expression on transferred CD27+ or CD27− YFP+ cells, at day 14 after transfer into CD45.1+ hosts (n = 14, CD27+; n = 15, CD27−). f, Flow cytometry analysis of BCL-2 expression in CD27+ and CD27− populations. Data are means ± s.e.m and representative of three (b–d, f) or at least five (e) independent experiments. Numbers in plots represent frequencies of cells in gates; numbers within histogram represent mean fluorescence intensities. Mann-Whitney U test (two-sided; non-parametric) was used in e to determine statistical significance.
