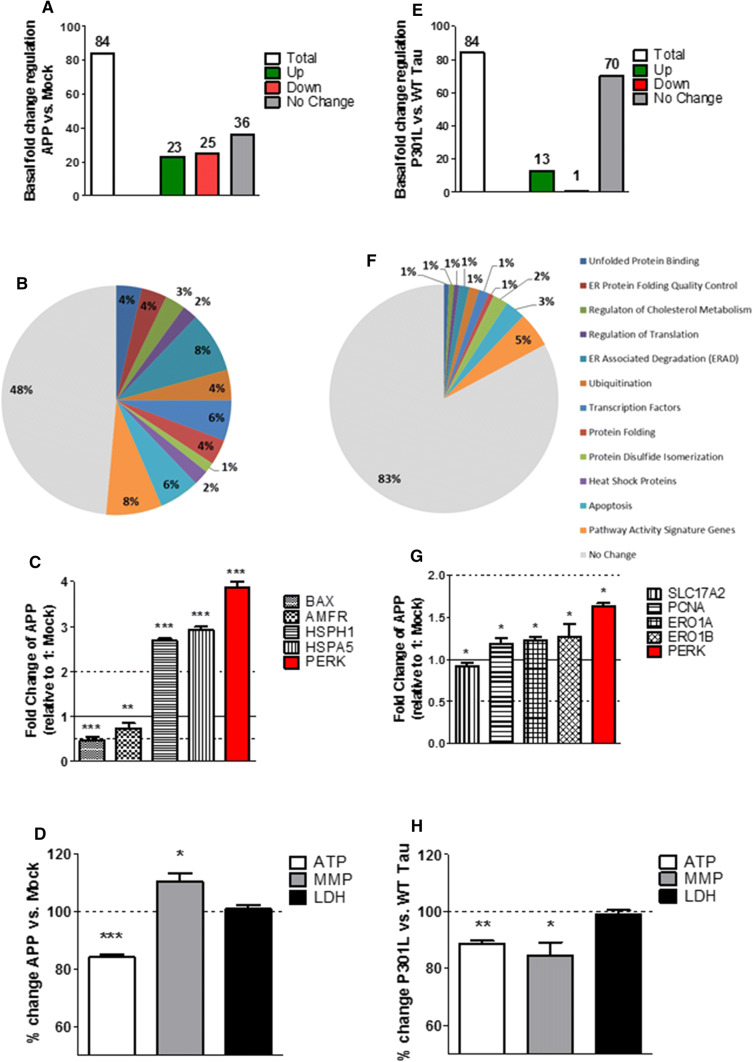
Fig. 1.
Regulation of UPR gene expression, mitochondrial bioenergetics, and cell viability in basal condition in APP and P301L cells. a, e Basal (non-treated) fold-change regulation of UPR genes in a APP cells compared to Mock cells and E P301L cells compared to WT Tau cells. b, f Pie charts of significantly up-/down-regulated UPR genes (colored) and the non-changed UPR genes (grey) sorted in groups by pathways in basal condition in b APP cells compared to Mock cells and f P301L cells compared to WT Tau cells. Of note, the total number of genes measured is 84; as several genes are involved in diverse pathways, the pie chart is composed of total 140 genes (see Suppl. Table 4). c, g Selection of significantly up-/down-regulated UPR genes in c APP cells and g P301L cells. Fold-change values greater than one indicate a positive- or an up-regulation, values less than one indicate a negative or a down-regulation. a–c, e–g Values were calculated based on a Student’s t test of the replicate values for each gene (n = 3 replicates of 3 independent experiments), and P < 0.05 were considered significant. d, h Basal ATP level, MMP level, and LDH level in d APP cells compared to Mock cells and (H) P301L cells compared to WT tau cells. Values represent the mean ± SEM (n = 18–60 replicates of 3–5 independent experiments) and were normalized to non-treated d Mock cells and h WT Tau cells (= 100%). Statistical analysis was performed using One-Way ANOVA followed by Turkey’s Multiple Comparison Test: *P < 0.05, ** P < 0.01 and ***P < 0.001. ATP adenosine triphosphate (major energy source of cells), MMP mitochondrial membrane potential (indicator of polarization state of the mitochondrial membrane), LDH lactate dehydrogenase (released by cells into medium when integrity of cell membrane is lost—cytotoxicity detection)

