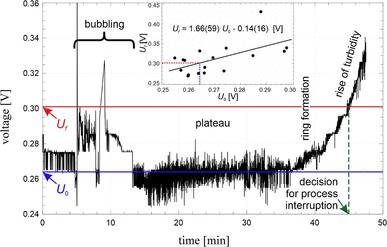
Fig. 2.

Recorded voltage (related to the scattered light as a measure of turbidity) vs. time for the process of evaporation of typical sample of urine. Decision to interrupt the evaporation was made automatically based on increase in urine sample turbidity and the recorded voltage. Ufinset a correlation between the voltage of plateau U0 and the voltage related to the interruption moment Uf
