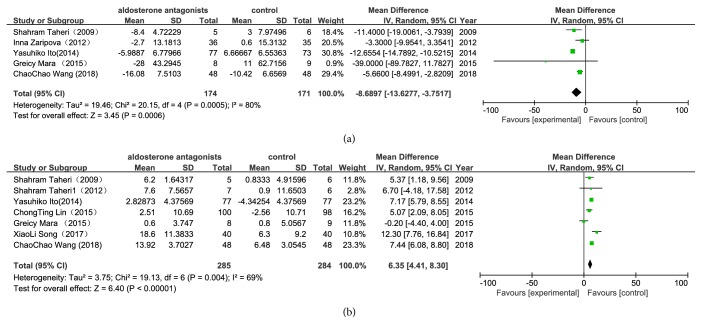
Figure 4.
Forest plots of the mean difference for the left ventricular mass index (LVMI) and the left ventricular ejection fraction (LVEF) ((a) LVMI; (b) LVEF). The Chi-squared test is a measurement of heterogeneity. P<0.05 indicates significant heterogeneity. Squares = individual study point estimates. Horizontal lines = 95% CIs. Rhombus = summarized estimate and its 95% CI. Fixed: fixed effect model. Random: random effect model.

