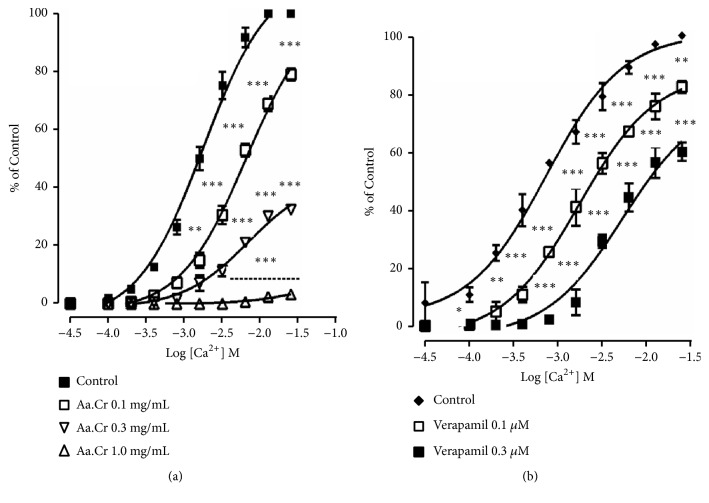
Figure 2.
Graph showing concentration response curves (CRCs) of calcium (a) in the absence and presence of Aa.Cr (b) in the absence and presence of verapamil in isolated rabbit jejunum preparation. Curves were constructed in Ca++-free but K+-rich Tyrode's solution. Data values are presented as mean ± SEM of 6-8 individual experiments and statistically analyzed with the Two-Way ANOVA followed by Dunnett's multiple comparison test. ∗ P<0.05, ∗∗ P<0.01, ∗∗∗ P<0.001 show a comparison of doses with respect to control.

