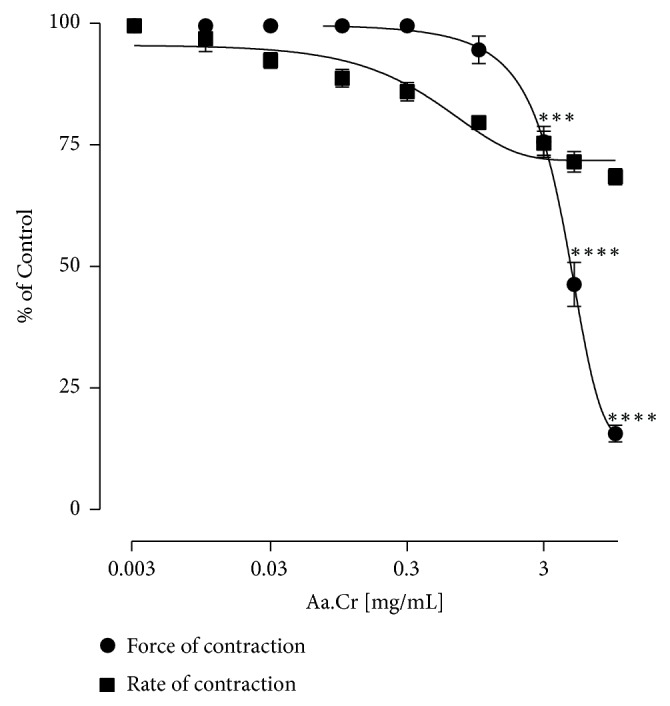
Figure 5.

Graph showing the concentration dependent effect of Aa.Cr on isolated rabbit atrium (Data sets are represented as mean ±SEM of 5-6 individual experiments). Two-Way ANOVA followed by Tukey's post-test was utilized to determine the significant difference among various concentrations (∗∗∗ P<0.001).
