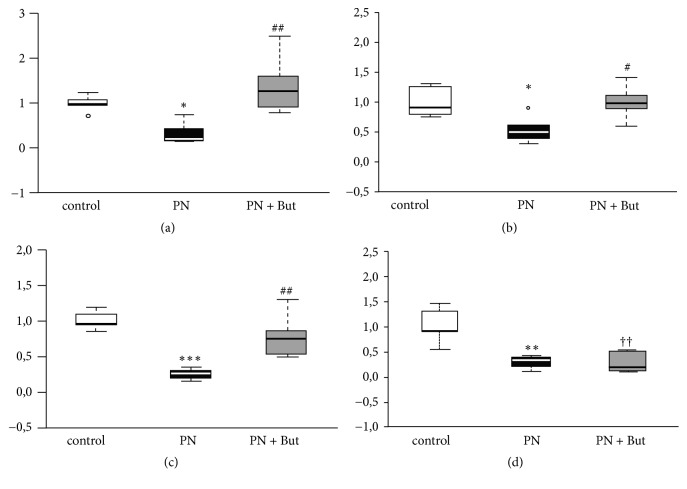
Figure 6.
The effect of butyrate on cytokine and IgA mRNA expression. (a) IL-10 expression in Peyer's patches; (b) IL-4 expression in Peyer's patches; (c) IgA expression in the intestinal mucosa; (d) IFNγ expression in Peyers patches. mRNA expression is expressed as a fold change over the control group. Results are presented using Tukey box-and-whisker plots as quartiles (25%, median, and 75%). ∗p<0.05, ∗∗p<0.01, ∗∗∗p<0.001 PN versus control; ††p<0.01 PN+But versus control; #p<0.05; ##p<0.01 PN+But versus PN.

