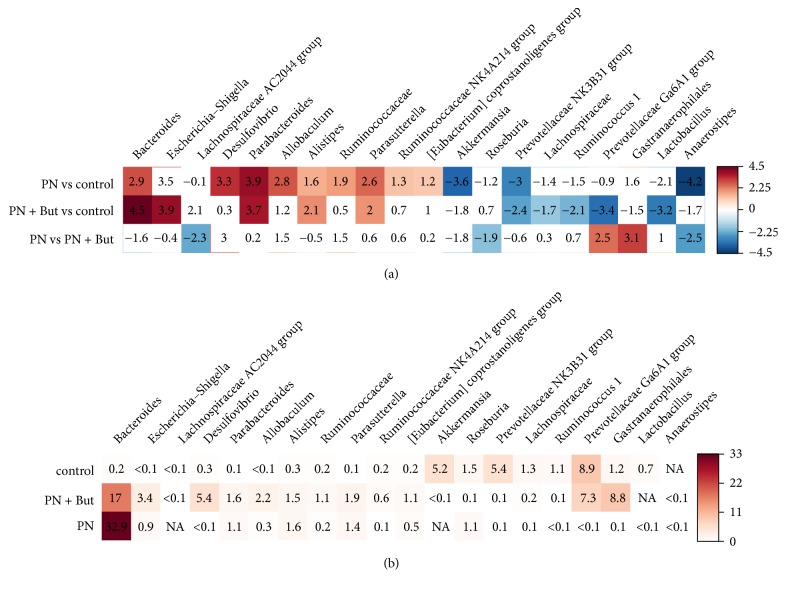
Figure 9.
Heatmap showing the fold change (a) and the abundance (%) (b) of genera that were differently (p<0.05) represented in at least two groups. Positive values correspond with an increase and negative values with a decrease in the first group compared with the second group. Shades of blue represent fold change decrease while shades of brown represent fold change increase. Uncoloured fields are not significant at p<0.05.

