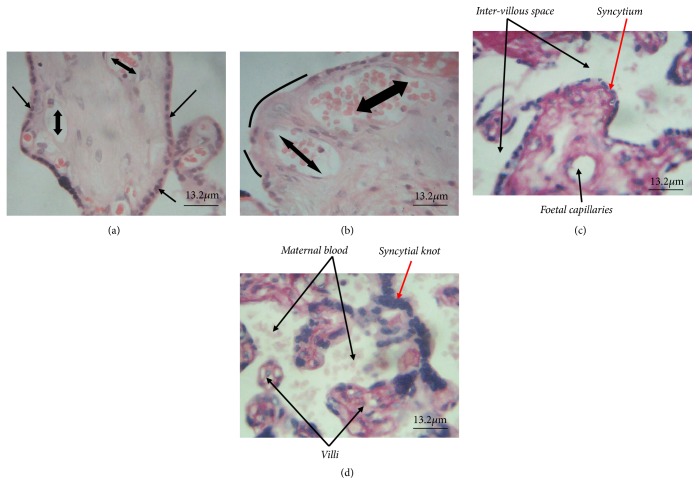
Figure 3.
Histomorphological assessment of placental tissues (H&E stained). (a) Placental tissue of control sample with normal syncytium indicated with single head arrow. (b) Placental tissue of case sample with syncytial necrotic areas indicated with curvy lines. Double head arrows in (a) and (b) indicate foetal capillaries. (c) and (d) show internal architecture of the placenta tissues in control and study groups, respectively; notable among them is the normal syncytium in (c) compared to the significant number of syncytial knots seen in (d), indicated by red arrows.

