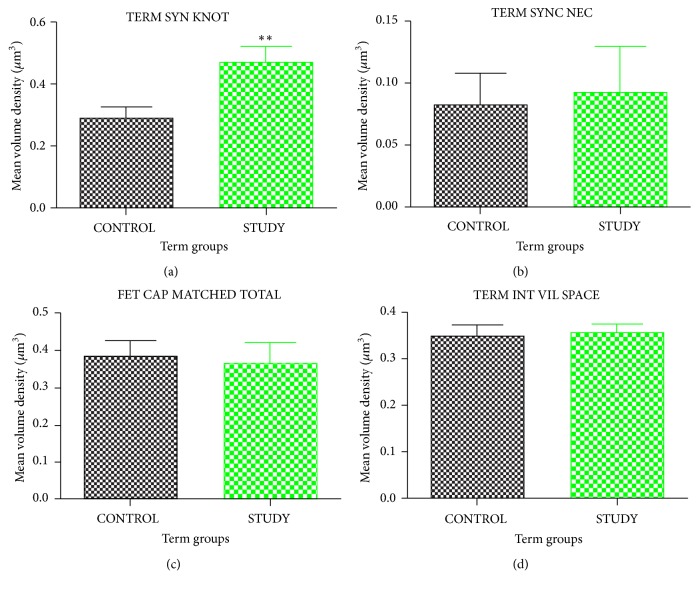
Figure 4.
Unpaired t-test analysis of placental parameters at term, comparing healthy (control) and Plasmodium-infected placenta (study group). (a) Volume density of syncytial knot. (b) Volume density of syncytial necrosis. (c) Volume density of foetal capillaries. (d) Volume density of intervillous space. SYN KNOT represents syncytial knot, SYNC NEC represents syncytial necrosis, FET CAP represents foetal capillaries, and INT VIL SPACE represents intervillous space. Values are expressed as mean ± SEM. P value represents significance level for unpaired t-test for time course assessment for term group comparison with ∗=P<0.05, ∗∗=P<0.01, and ∗∗∗=P<0.001.

