
Figure 1.
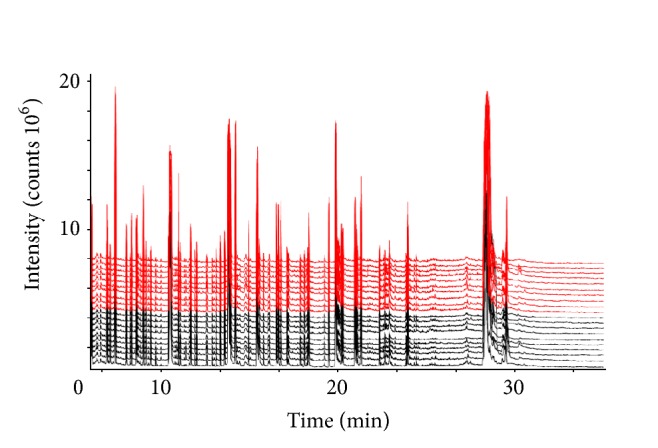
Typical GC/MS chromatograms of extracts from brain tissue of 20 mice. Top 10 lines (red): GPr group and the other 10 lines (black): control group.
Official websites use .gov
A
.gov website belongs to an official
government organization in the United States.
Secure .gov websites use HTTPS
A lock (
) or https:// means you've safely
connected to the .gov website. Share sensitive
information only on official, secure websites.
Typical GC/MS chromatograms of extracts from brain tissue of 20 mice. Top 10 lines (red): GPr group and the other 10 lines (black): control group.