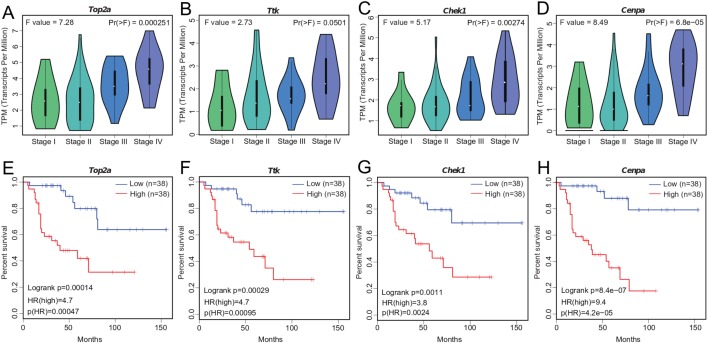
Figure 4. Significant correlation between hub gene expression with pathological stage and survival.
(A–D) Significant correlation between expression levels of TOP2A, TTK, CHEK1, and CENPA with ACC pathological stage. (E–H) Survival plot of OS in ACC. Higher expression (red line) of TOP2A, TTK, CHEK1, and CENPA indicates poorer prognosis. HR, hazard ratio.

