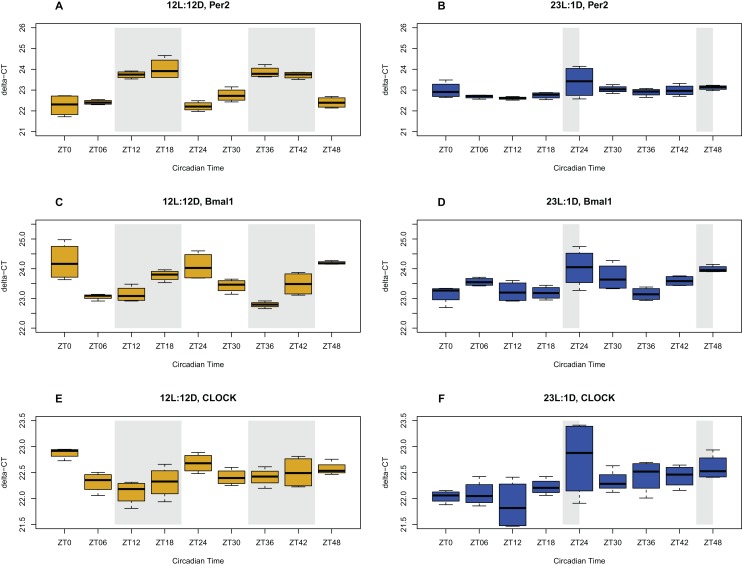
Figure 1. Circadian gene expression profiles in the brain.
Expression of clock genes in the brain tissue of chicks entrained to either normal (12L:12D) (yellow) or extended photoperiods (23L:1D) (blue), measured with qPCR. The shaded areas represent the hours of darkness. X-axis give the time scale in zeitgeber (ZT) over the 48 h sampling period, and the Y-axis shows the level of gene expression in delta-CT. Expression patterns of the Per2, Bmal1, and Clock genes in NP (A, C, E respectively), and in EP (B, D, F respectively) are shown.

