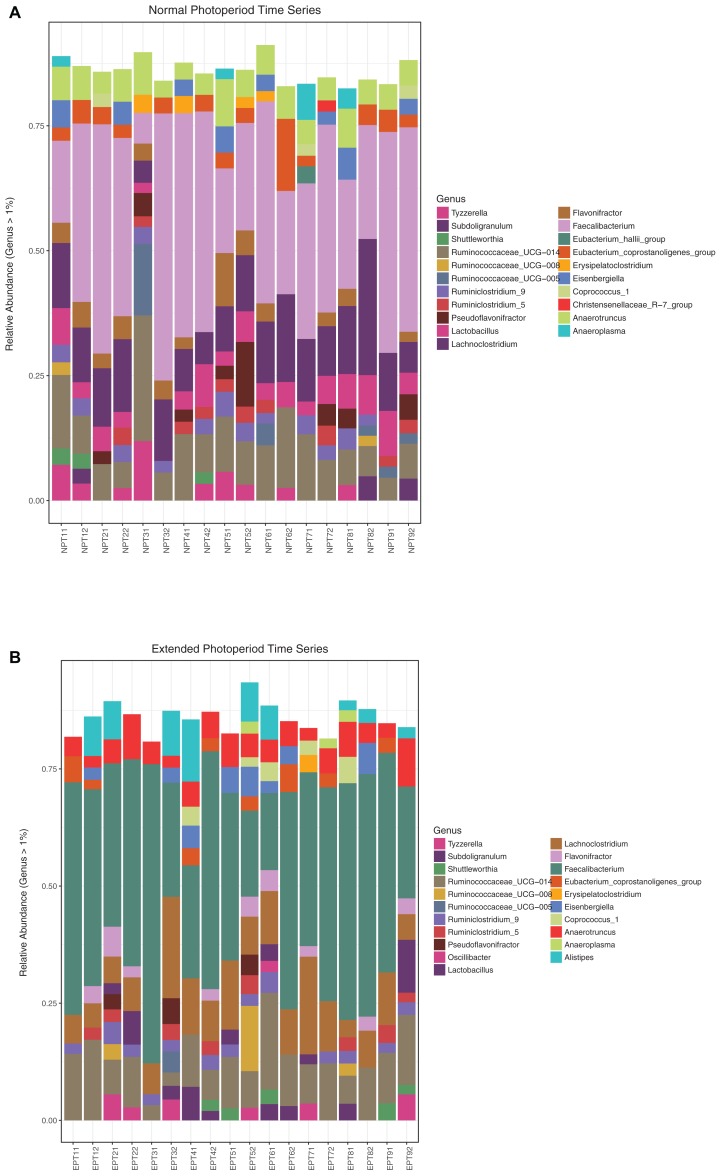
Figure 3. Column plots of relative abundance at the genus level.
Relative abundance (>1%) at the taxonomic genus level depicting the diversity of cecal microbial communities in chicks entrained to the normal photoperiod (A) and the extended photoperiod (B). NP and EP labels correspond to birds sampled from either treatment, with two replicates per time point. Samples were taken at 6-h intervals over a 48-h period from Day 19–21.

