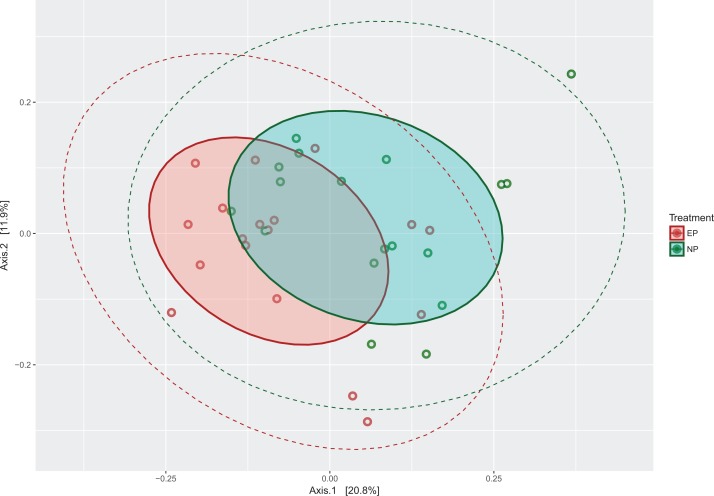
Figure 4. PCoA plot of microbiota communities from the two photoperiods.
Principal Coordinate Analysis (PCoA) plot of cecal microbial communities entrained under normal photoperiods (NP) and extended photoperiods (EP). Solid shaded ellipses around colored points show the 90% Euclidean distance from the center, whereas dashed lines show the 95% normal distribution span.

