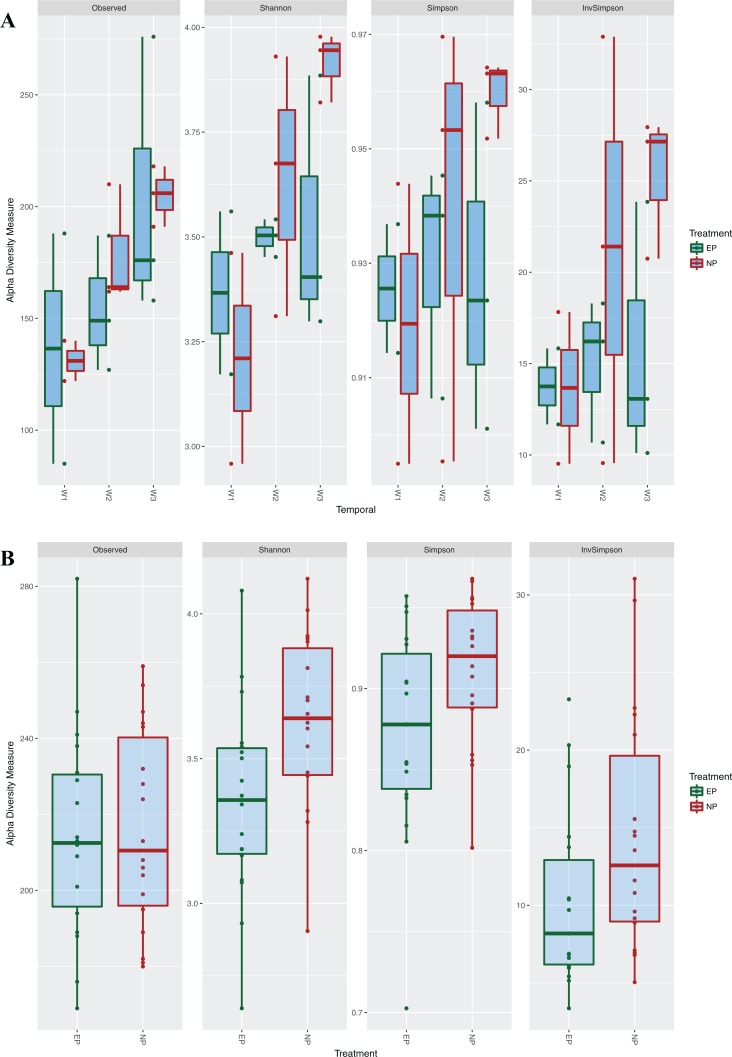
Figure 5. Alpha diversity measures among photoperiod regimes.
Alpha diversity measures for the two different photoperiods, normal (NP) (12L:12D) and extended (EP) (23L:1D). A shows boxplots of α diversity during the entrainment period (first 3 weeks), divided by each week. B shows boxplots of α diversity estimates from samples taken during the circadian experiment.

