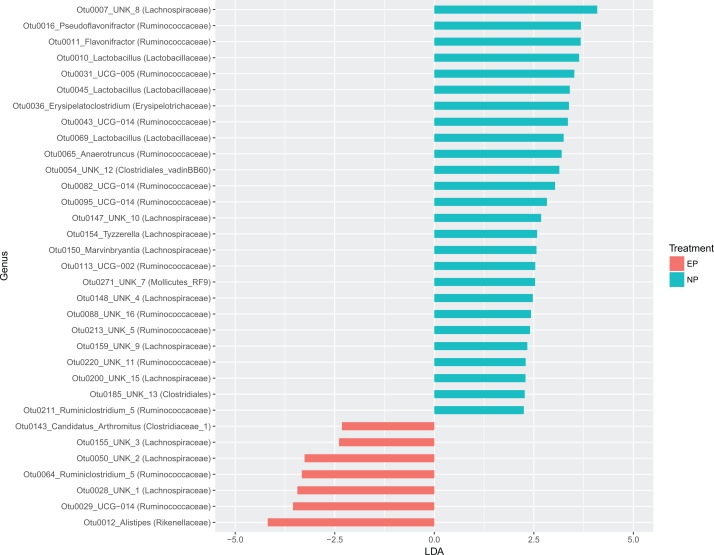
Figure 6. LDA plot showing differential enrichment of taxa among photoperiods.
A plot of the results from Linear Discriminant Analysis Effect Size to determine differential enrichment of taxa between photoperiod treatments. Of 33 differentially enriched taxa between treatments, 26 were enriched above an LDA score of 2 the normal photoperiod treatment, whereas the rest were enriched in the extended photoperiod treatment.

