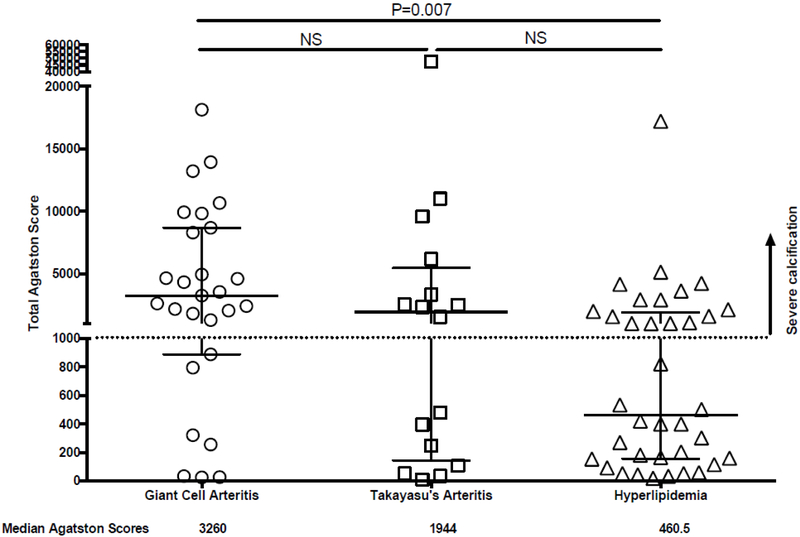
Figure 2.
Scatter plot of total Agatston scores throughout the large arteries. Total Agatston scores are shown for patients with giant cell arteritis, Takayasu’s arteritis, and hyperlipidemia. Median Agatston scores were significantly greater in patients with giant cell arteritis compared to patients with hyperlipidemia. Agatston scores > 1000 (dotted line) were considered representative of severe vascular inflammation. Median values and interquartile ranges are depicted. NS = not significant.

