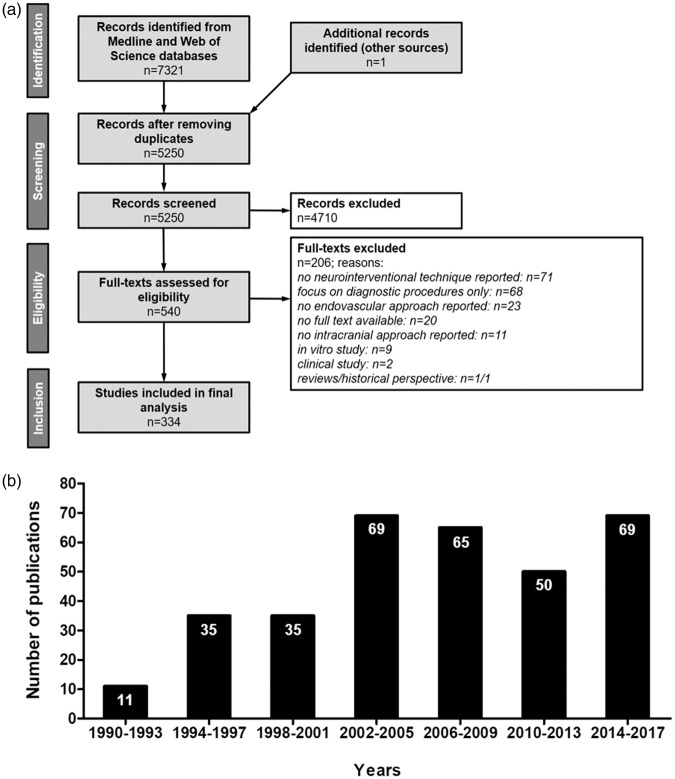
Figure 1.
Study data. (a) PRISMA flow chart of selection process; systematic research in Medline and Web of Science databases, inclusion of studies that address neurointerventional research, test endovascular techniques and were performed in large animals (b) Study numbers show a continuous increase from 1990 until 2005, followed by a slight decline and a recent increase to all-time highs.

