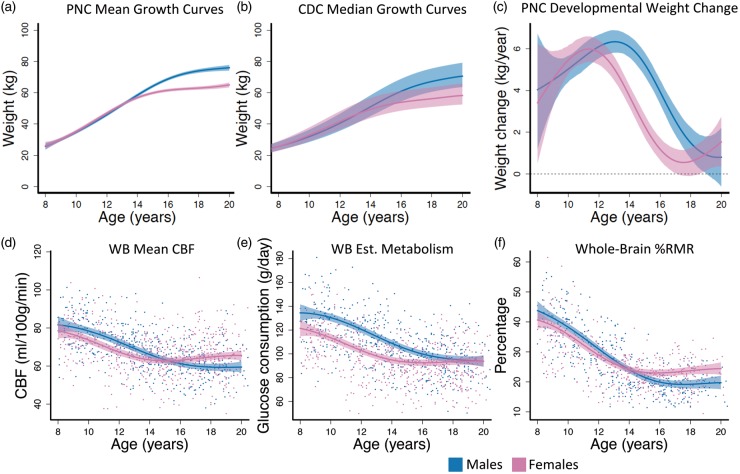
Figure 1.
Males and females exhibited different developmental curves in weight, weight-change, and whole-brain CBF-derived imaging measures. (a) PNC estimated mean growth curves. (b) CDC median weight trajectories from May 2000. Dashed lines are 25% and 75% percentiles. (c) Females had an earlier peak and decline in rate of weight-change than males. (d) CBF declined for females until age 15 where it began to increase, while CBF in males declined until age 18 where the curve flattens. (e) Whole-brain glucose consumption was lower in females through development until adulthood where males and females had identical brain glucose consumption. (f) %RMR was approximately equal in males and females until reaching adult resting levels. Fitted curves are estimated with generalized additive models (GAMs). Colored dashed lines in (a) and (c–f) are 95% simultaneous confidence intervals; WB: whole brain; Est: estimated.

