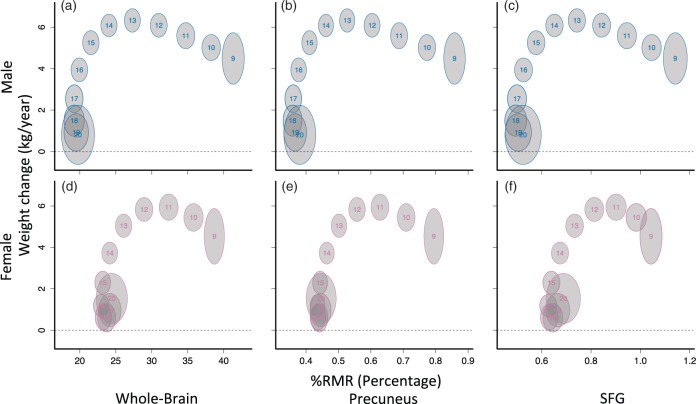
Figure 3.
Whole-brain (a, d) and regional (b, c, e, f) %RMR weight-change curves differ by sex. Each curve was fit separately as a function of age using generalized additive models (GAMs), and the location for each age was plotted. Each number on the plots indicates a corresponding age; gray bubbles are 95% marginal confidence regions. Larger bubbles are due to noisier estimates toward the edges of the sample range. The bivariate relationship between weight-change and whole-brain %RMR appeared shifted forward temporally for females relative to males; however, after peak weight change, female %RMR was higher in all regions. %RMR reaches adult levels before weight-change reaches zero.

